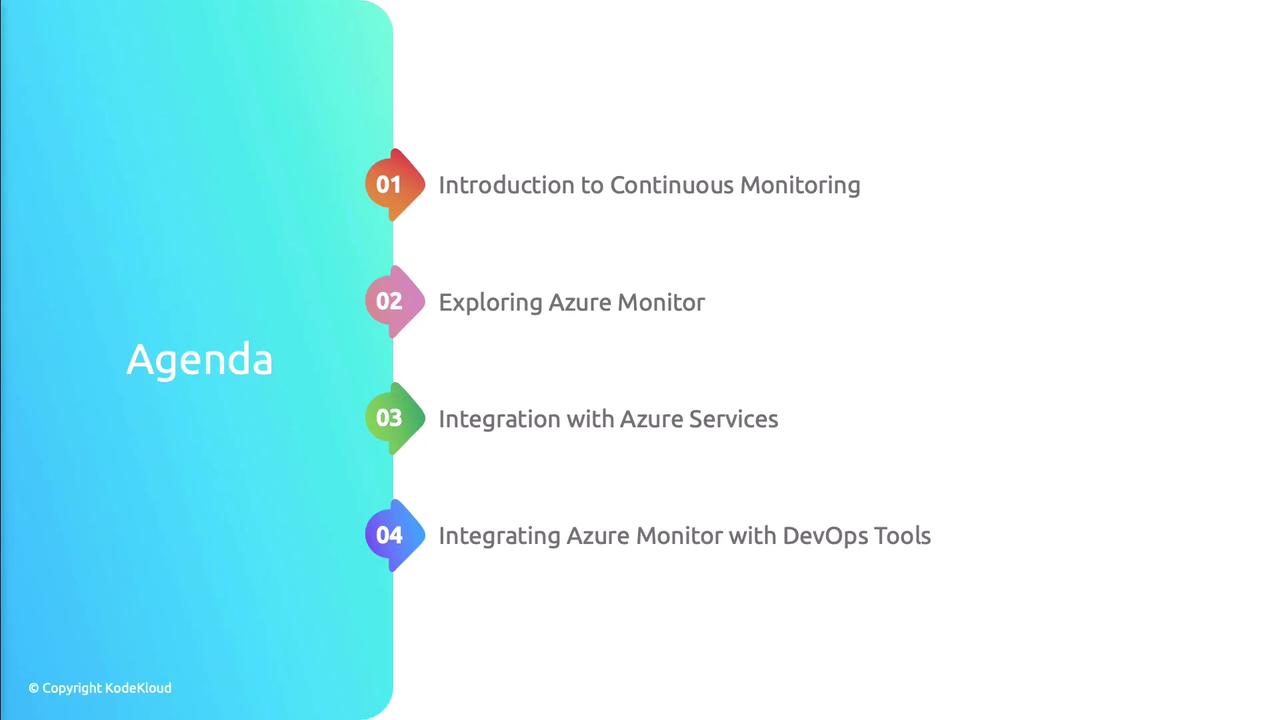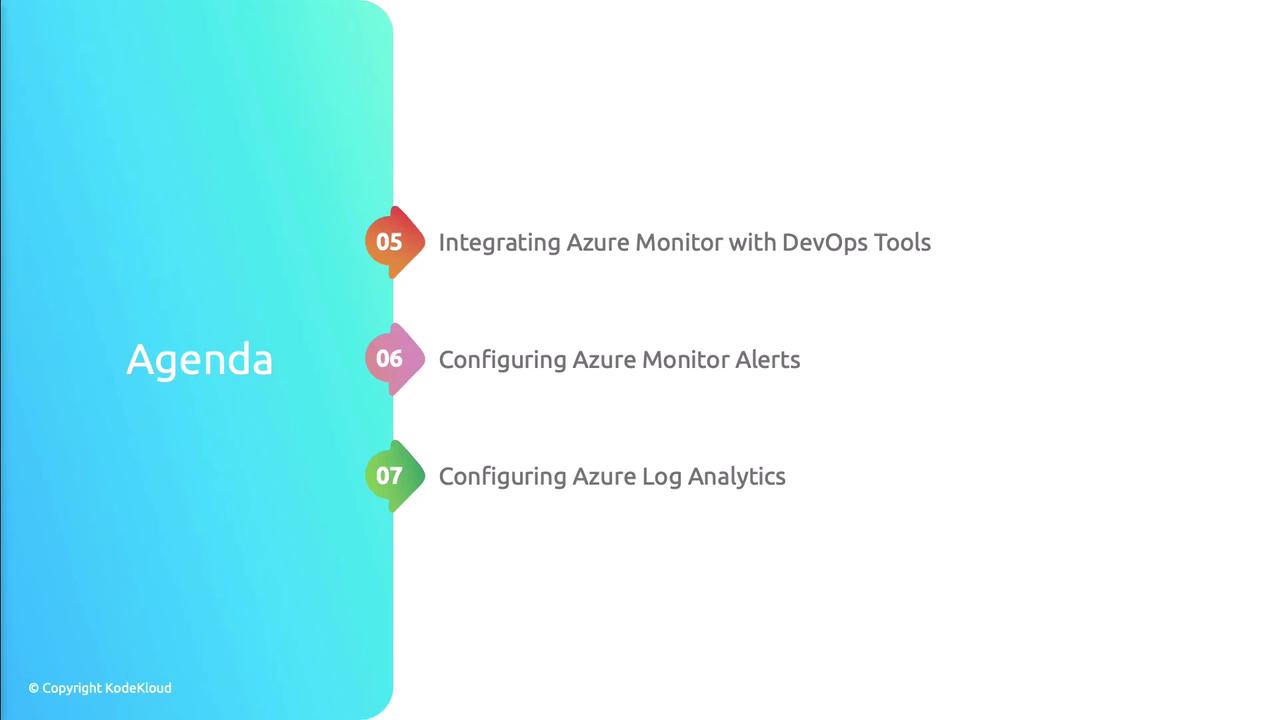
Agenda
| Topic | Description |
|---|---|
| Continuous Monitoring | Importance of proactive issue detection in DevOps |
| Azure Monitor Features | Overview of metrics, logs, and alerts |
| Service Integrations | Connecting Azure Monitor with native Azure services |
| Log Analytics | Querying and visualizing telemetry |
Practical Integration with DevOps Tools
In this section, we’ll walk through hands-on examples to integrate Azure Monitor into your CI/CD pipelines and operational workflows:- Connecting Azure Monitor with popular DevOps platforms
- Configuring custom alerts to triage and respond faster
- Provisioning and managing Log Analytics workspaces via Infrastructure as Code

Automate workspace provisioning using ARM templates or Terraform.
Here’s a quick Azure CLI example to create a Log Analytics workspace:
Here’s a quick Azure CLI example to create a Log Analytics workspace:
Configuring Telemetry Collection
To achieve full-stack observability, you must collect telemetry across applications, VMs, containers, storage, and networks. Azure offers specialized solutions for each domain.
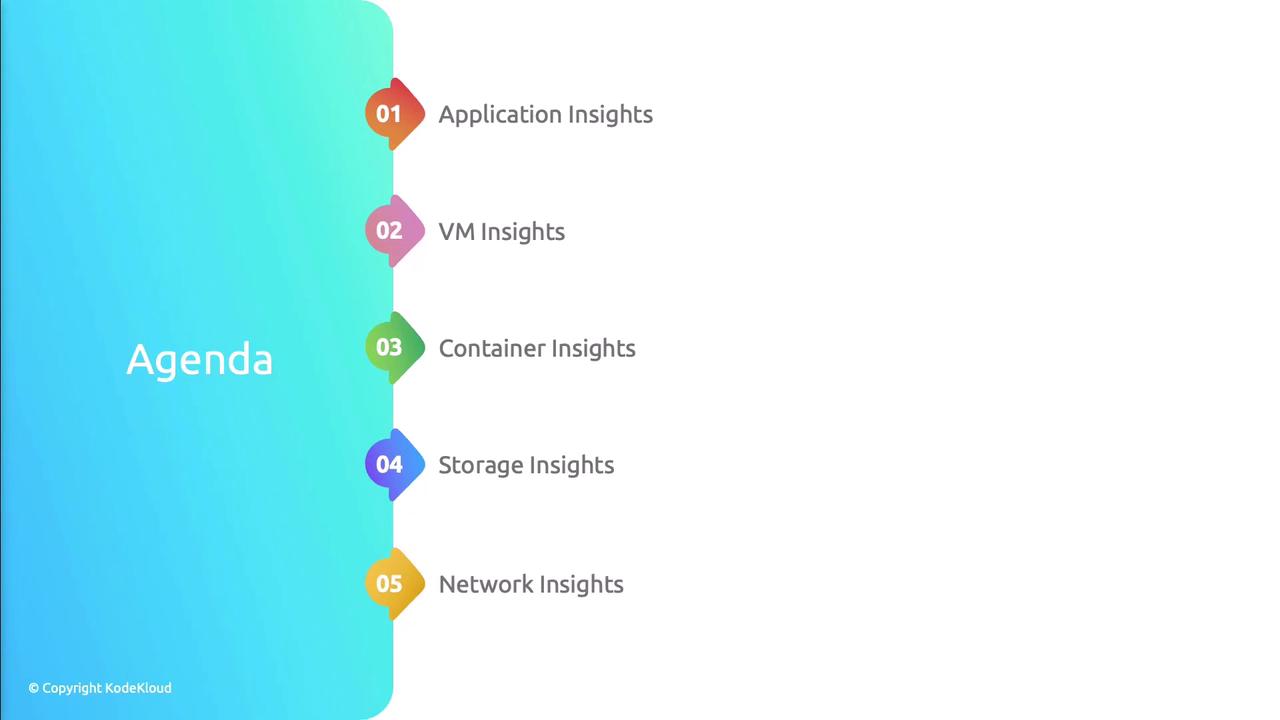
Azure Telemetry Services Overview
| Service | Use Case |
|---|---|
| Application Insights | Monitor application performance and end-user experience |
| VM Insights | Collect host-level metrics and process information |
| Container Insights | Analyze container health in AKS and other Kubernetes |
| Storage Insights | Track I/O metrics and health of storage accounts |
| Network Insights | Visualize network topology and performance issues |

By the end of this lesson, you’ll be able to:
- Set up data collection across multiple Azure services
- Author KQL queries to analyze and correlate logs and metrics
- Build interactive dashboards in Azure Monitor and Log Analytics