This guide explores creating and managing multi-container pods in Kubernetes, including log shipping to Elasticsearch using a sidecar container.
In this guide, we explore a lab exercise on multi-container pods in Kubernetes. We will inspect pods to determine the number of containers contained, create a multi-container pod, and update an existing pod by adding a sidecar container that ships logs to Elasticsearch. All diagrams have been retained in their original placements.
Begin by inspecting the red pod to determine the total number of containers. In the cluster, observe that the “READY” column displays the number of containers versus those that are ready. In this example, there are three containers. You can verify this by running the command:
Copy
Ask AI
kubectl describe pod red
In the output, under “Containers”, you will see entries for “apple”, “wine”, and “scarlet” that confirm the existence of three distinct containers. Below is an excerpt of the container details for the red pod:
For the blue pod, inspect the container details similarly. This pod includes two containers, “teal” and “navy”. The command below confirms their configuration:
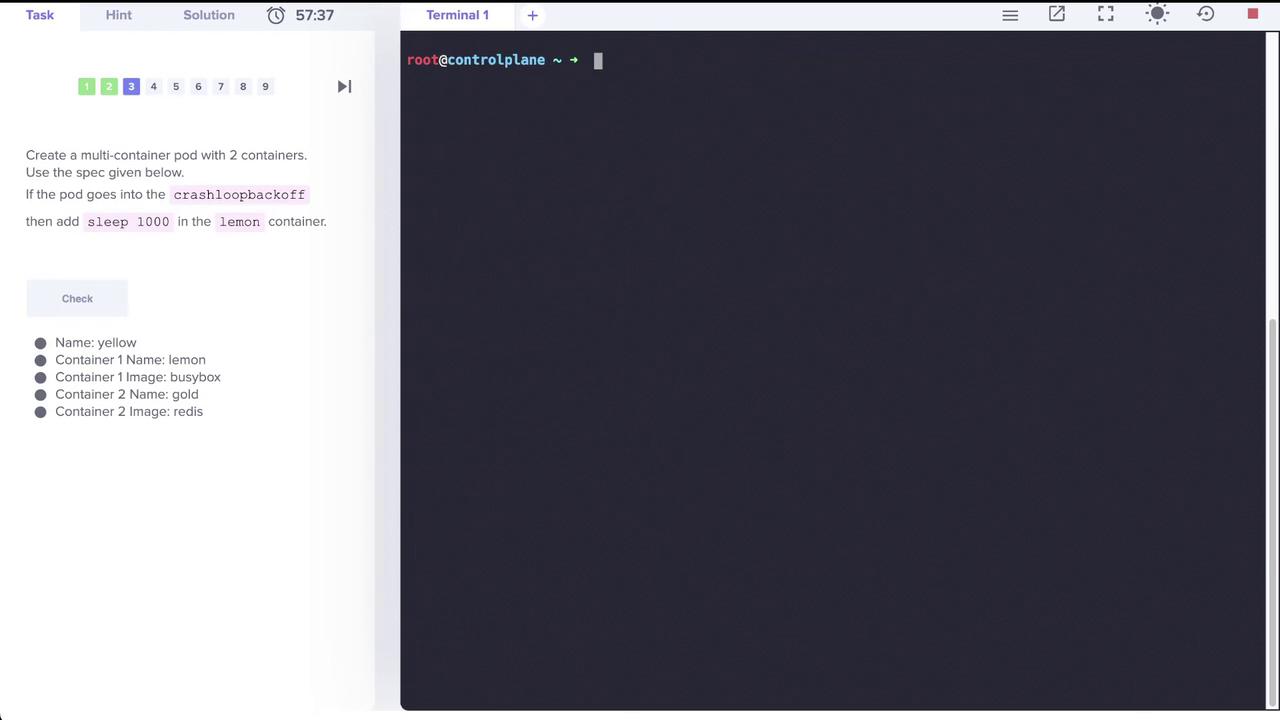
Modify the YAML file to change the first container’s name from yellow to lemon, add the sleep command, and include a second container named gold with the Redis image:
Apply the manifest to create the pod. After the pod is created, verify that it contains two containers: one running BusyBox (with the specified sleep command) and the other running Redis.
After deploying the pod, use kubectl get pods and kubectl describe pod yellow to ensure that both containers are correctly configured and running.
Review the details of the application pod to determine where logs are stored. The pod uses the kodekloud/event-simulator image, and its logs are written to a file (for example, /log/app.log). To inspect the pod, run:
Copy
Ask AI
kubectl describe pod app -n elastic-stack
You can also view the logs directly by using:
Copy
Ask AI
kubectl logs app -n elastic-stack
Within these logs, search for entries indicating login issues, such as:
Copy
Ask AI
[2022-04-17 18:21:58,698] WARNING in event-simulator: USER5 Failed to Login as the account is locked due to MANY FAILED ATTEMPTS.
This indicates that USER5 is experiencing login problems.To further confirm the logs stored on disk within the pod, execute:
To enable log shipping to Elasticsearch, update the app pod to include a sidecar container. This sidecar, named sidecar, uses a custom Filebeat image (kodekloud/filebeat-configured) and shares the same log volume as the application container.An image illustrating the pod configuration with the Filebeat sidecar is shown below:
Pod updates do not allow adding or removing containers directly. If you encounter an error during the update (e.g., “pods ‘app’ is invalid”), save your changes and force a replacement with:
After applying the changes, verify that logs are being shipped to and visualized in Kibana. Follow these steps:
Open the Kibana UI.
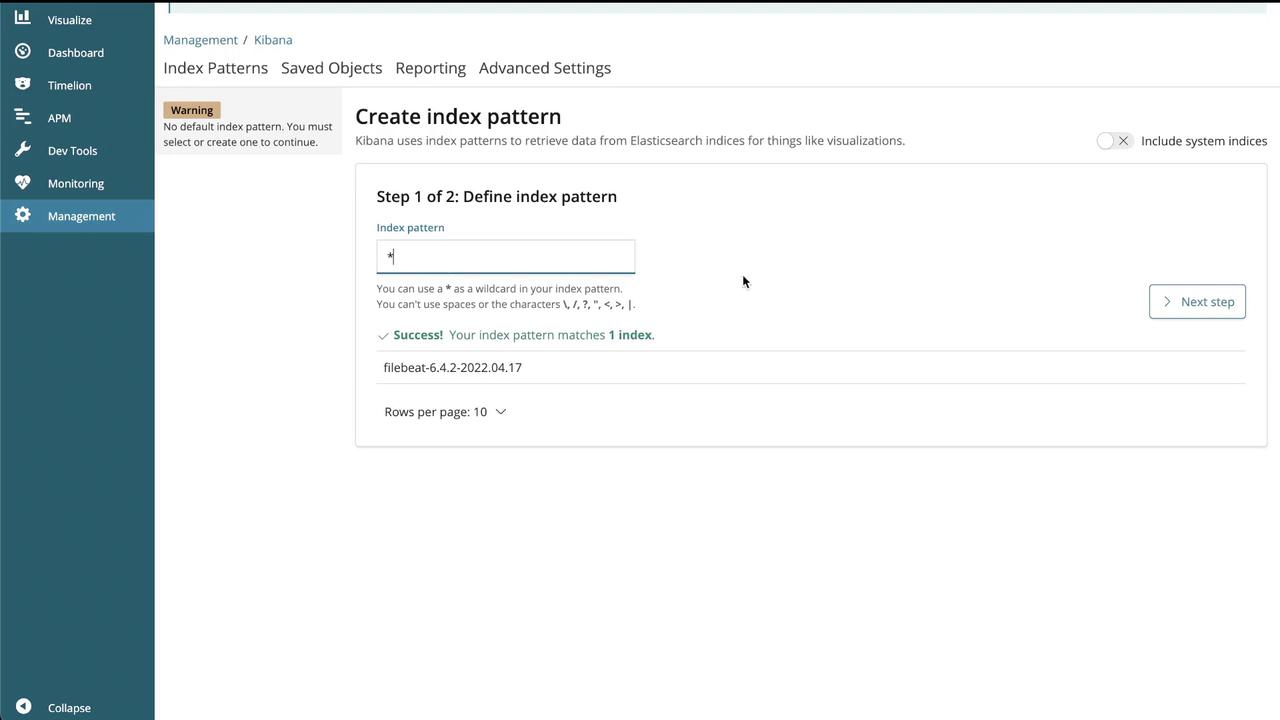
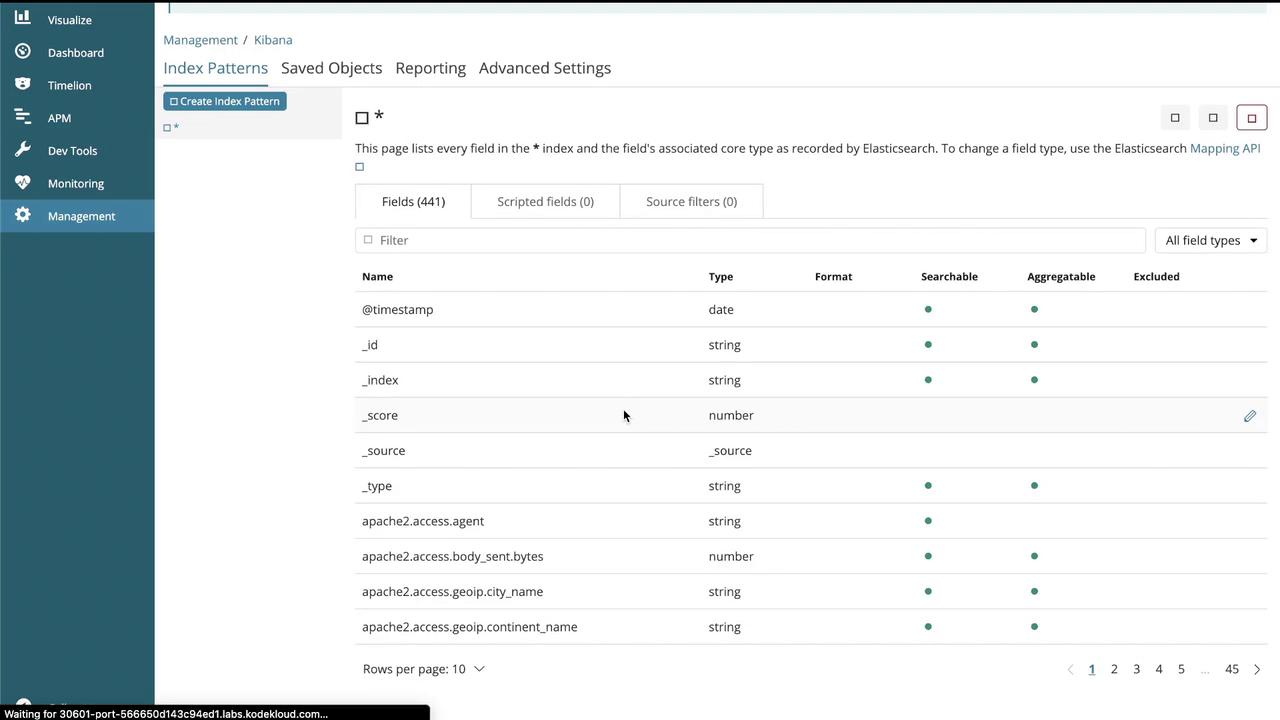
When prompted, create an index pattern (e.g., filebeat-* or as instructed in your lab).
Set the time filter field name if required.
Click “Start” or “Create” to finalize the index pattern.
The screenshot below shows the index pattern creation interface:
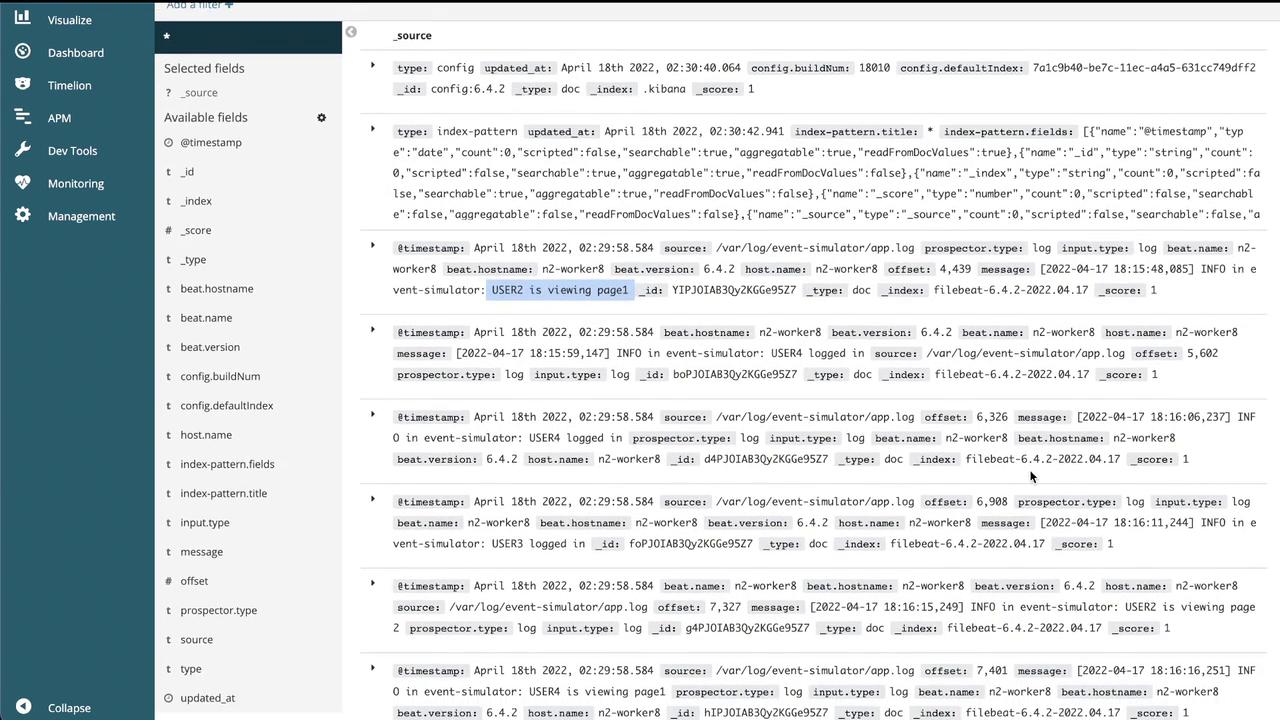
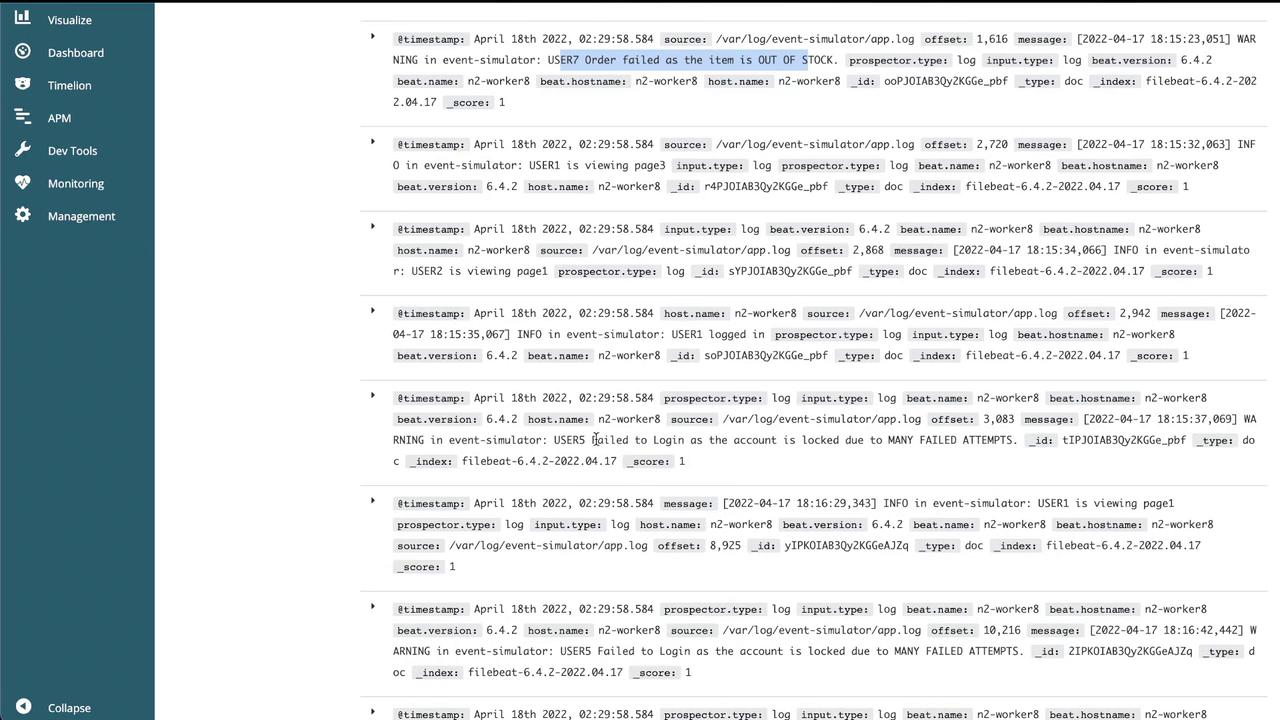
Then, navigate to the “Discover” section to view the logs:
Additional dashboards will highlight:
Log entries with timestamps and corresponding messages.
Detailed event information, including user actions, warnings, and order failures.
With these steps completed, logs from the application are successfully forwarded to Elasticsearch and visualized in Kibana. This configuration can be extended to scale across multiple pods or deployments within your Kubernetes environment.That concludes our guide on multi-container pods and log shipping in Kubernetes. Happy learning!For further information, consider visiting the following resources: