Data Consumption and Analysis
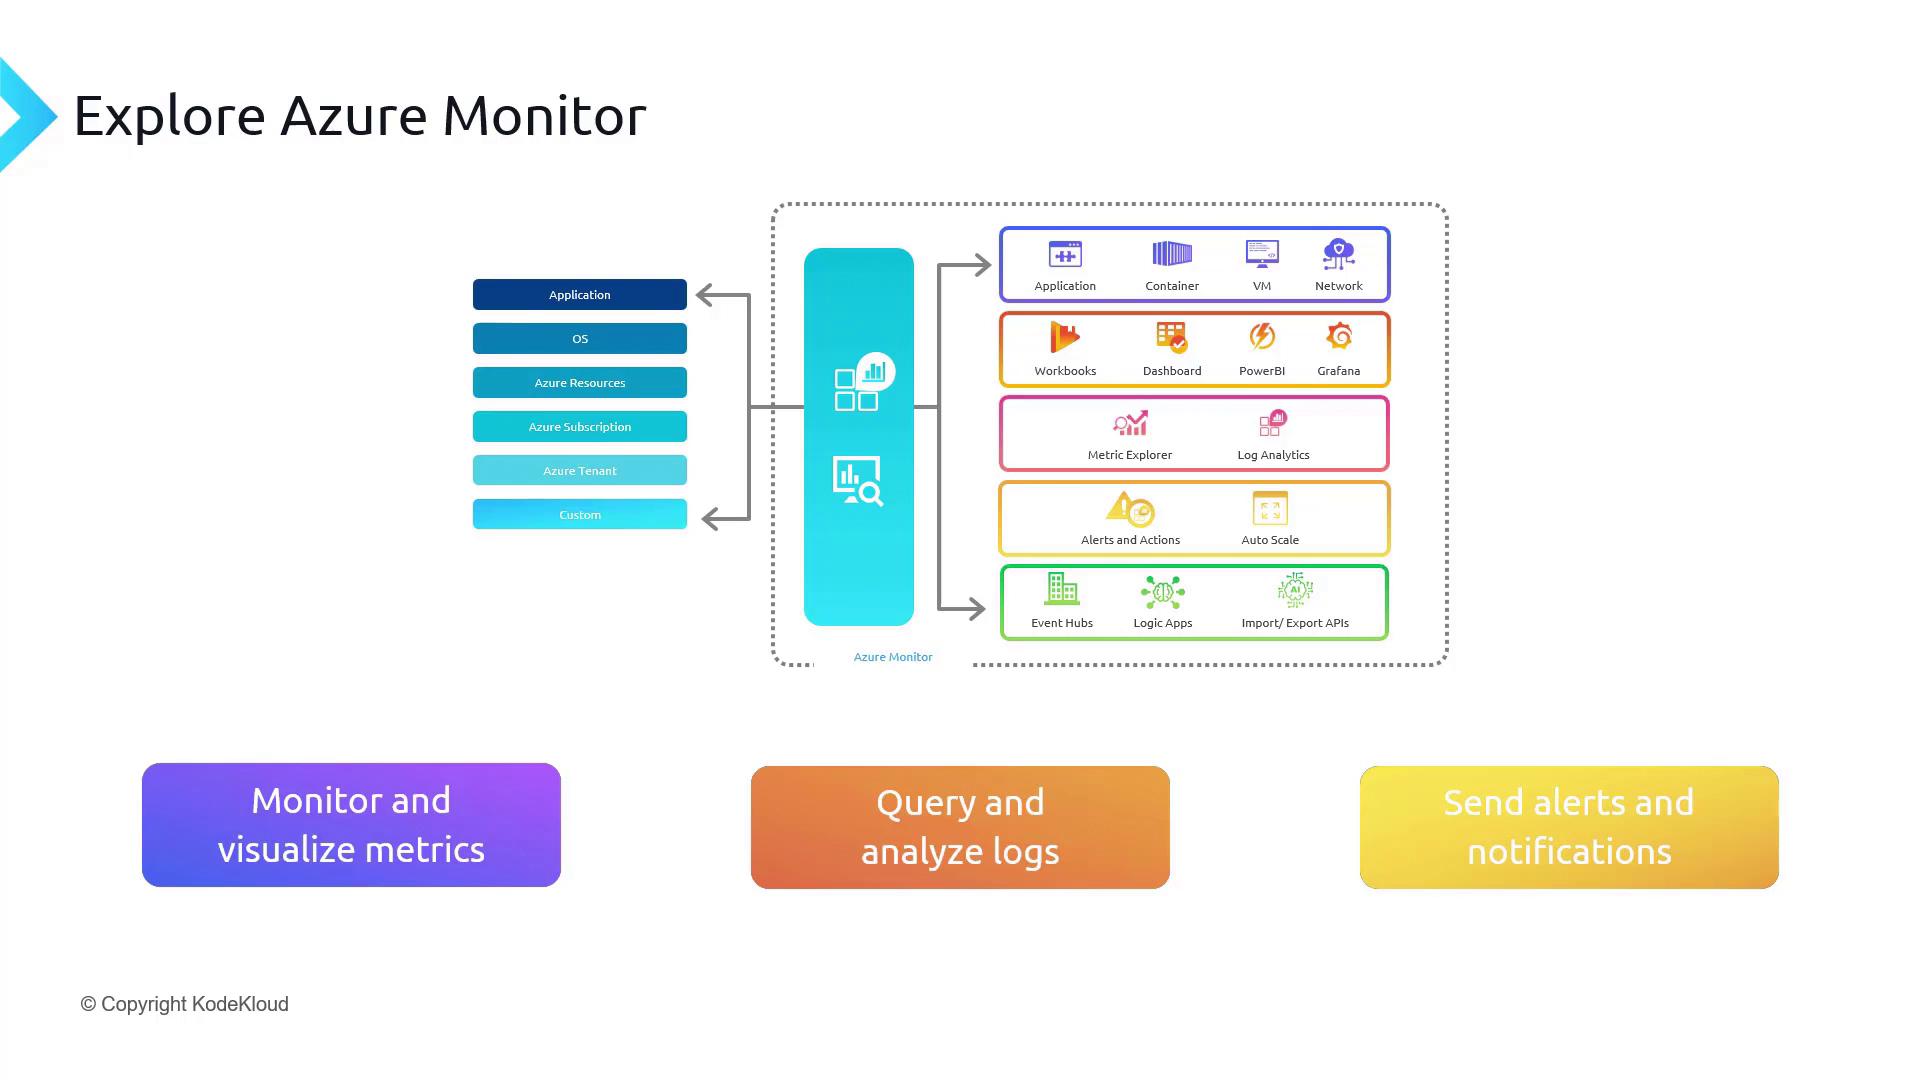
Once collected, monitoring data can be consumed by a myriad of services. Azure Monitor tools are designed to offer precise insights, dynamic visualizations, and in-depth analysis to meet your operational needs. For example:- To generate actionable insights, you can leverage tools like Application Insights, Container Insights, VM Insights, and Network Insights. These come with detailed visualizations and interactive workbooks that simplify data interpretation.
- For visual data representation, explore options such as Azure Workbooks, dashboards, Power BI, and Grafana.
- For advanced analysis, use Metric Explorer to examine time-series metrics or Log Analytics to dive deep into logs. Additionally, Change Analysis helps you monitor and review system modifications.
Overview of the Azure Monitor Suite
The Azure Monitor ecosystem is divided into two primary areas:- Data Sources: These serve as the backend of the monitoring platform and include logs, metrics, traces, and change records.
- Data Consumers: On this end, various tools and services utilize the collected data to provide insights and analytics.
Understanding Key Data Types
Azure Monitor categorizes its data into four core types:- Metrics: These are numerical snapshots of system performance captured over time. Stored as time-series data, metrics are ideal for tracking values like CPU usage (e.g., 80% at time 555 and 81% at time 556).
- Logs: These textual records are generated by systems (e.g., events or syslogs). For instance, any entry in the Windows Event Viewer qualifies as a log.
- Traces: Traces offer a detailed journey of a request across various services and components, helping you identify delays and understand system call flows.
- Changes: Change tracking is essential for application management. Powered by Azure Resource Graph, Change Analysis records every update or modification—such as a change to a VM property—allowing you to review both the changes and the previous values.
Core Features of Azure Monitor
Azure Monitor’s functionality can be summarized into three essential features that ensure the health and performance of your applications and infrastructure:- Monitor and visualize metrics.
- Query and analyze logs.
- Send alerts and notifications.
Utilizing these core features provides a robust framework for proactive system management and improved operational efficiency.