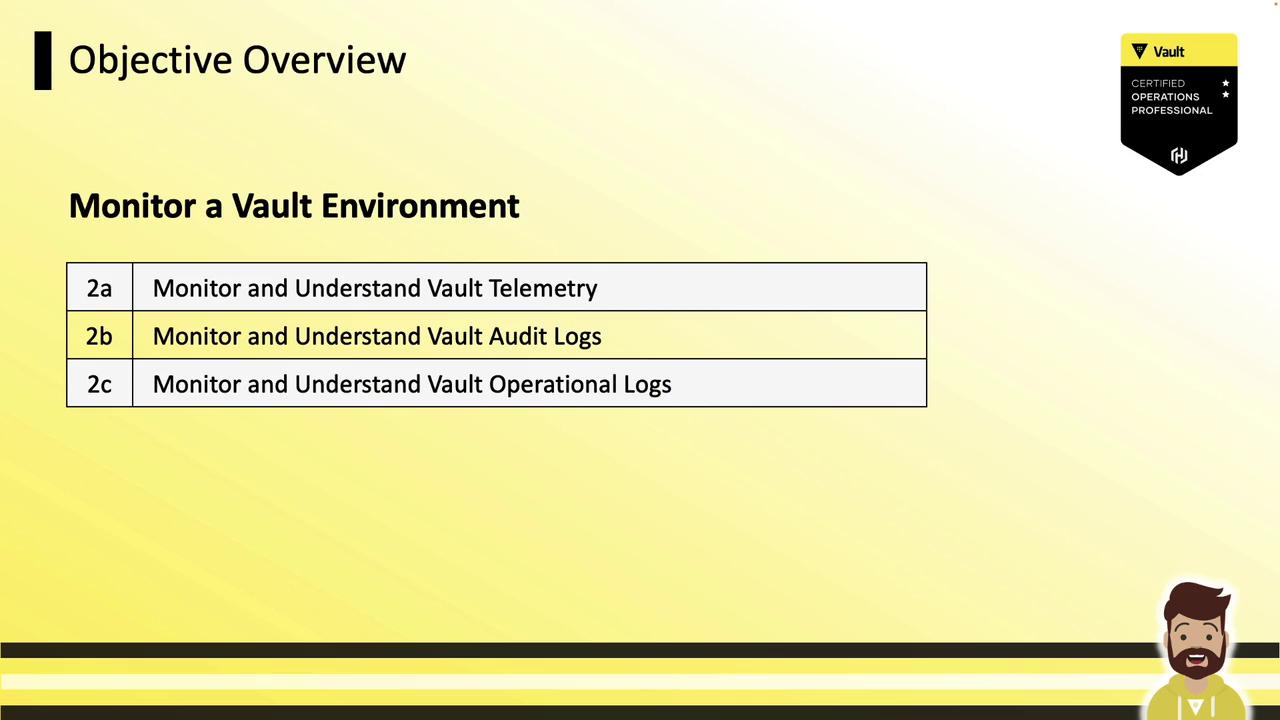
- Monitor and understand Vault telemetry
- Monitor and understand Vault audit logs
- Monitor and understand Vault operational logs
“Understand” requires conceptual knowledge; “monitor” implies hands-on experience with setup or output analysis.
Vault Telemetry
Vault telemetry provides runtime metrics on performance, resource usage, and component health. Leveraging telemetry helps you:- Detect performance bottlenecks
- Debug latency spikes
- Track cluster health over time

- Metrics examples: request latency, storage write/read durations, seal/unseal status
- Aggregation interval: every 10 seconds
- In-memory retention: 1 minute
- Collection agents: Datadog Agent, Prometheus
node_exporter, etc., polling Vault then forwarding data upstream
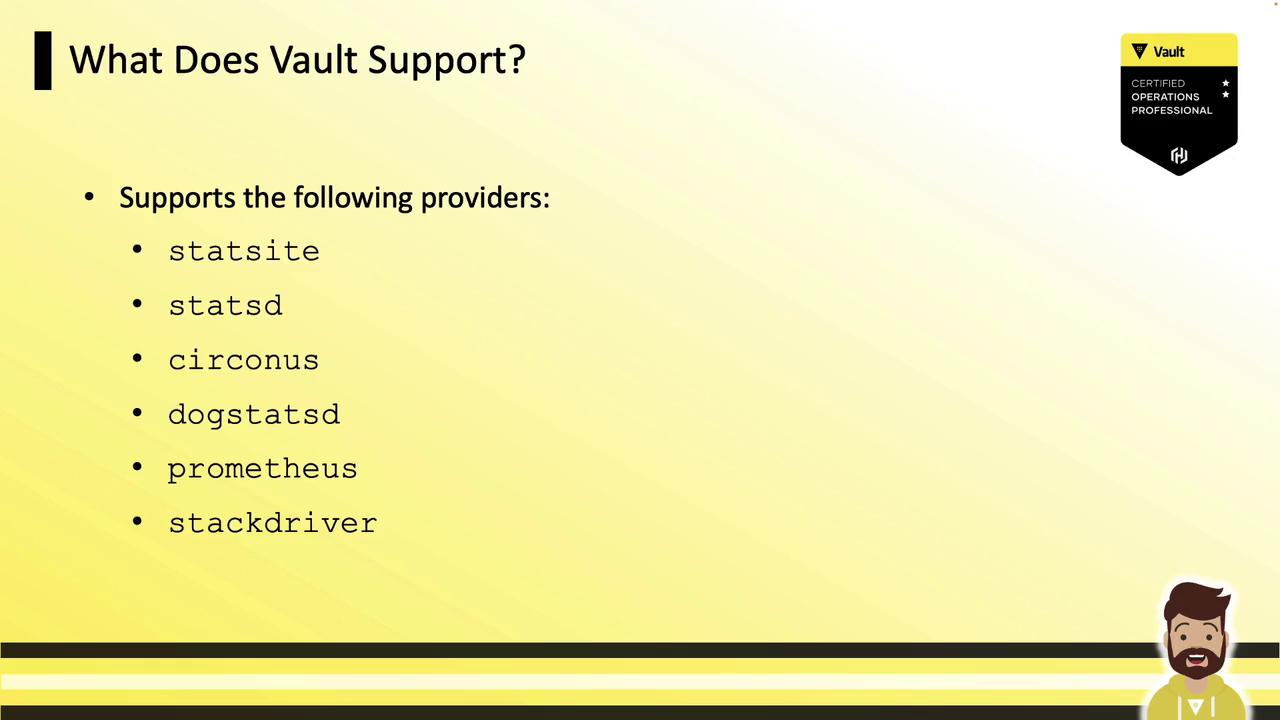
Supported Telemetry Providers
Configure your monitoring backend in thetelemetry stanza of config.hcl. Vault supports:
| Provider | Protocol | Common Use Case |
|---|---|---|
| statsite | Carbon | Graphite integrations |
| statsd | StatsD | Generic metrics pipelines |
| circonus | Circonus | High-scale monitoring |
| dogstatsd | DogStatsD | Datadog |
| prometheus | Prometheus | Prometheus + Grafana |
| stackdriver | Stackdriver | Google Cloud Monitoring |
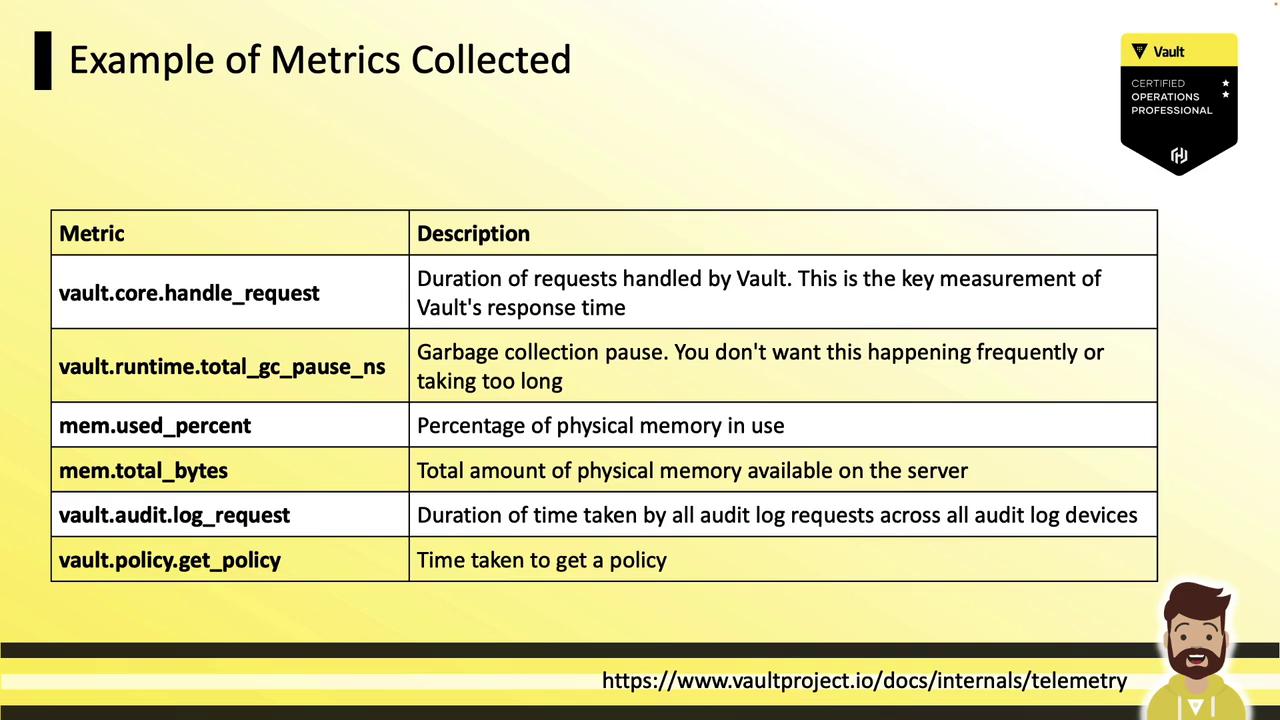
Example Telemetry Metrics
Vault emits dozens of metrics covering HTTP handlers, storage backends, memory usage, and GC pauses:| Metric | Description |
|---|---|
vault.core.handleRequest | Duration of handled requests (ms) |
vault.runtime.totalGCPauseNS | GC stop-the-world pause duration (ns) |
vault.runtime.memoryUsePercentage | Percentage of physical memory in use (%) |
vault.runtime.memoryUseTotalBytes | Total physical memory used (bytes) |
vault.audit.log.request | Time to write to all audit devices (ms) |
vault.policy.getPolicy | Policy retrieval latency (ms) |
Configuring Telemetry
Add or update thetelemetry block in your Vault HCL config (config.hcl), then restart or reload Vault:
dogstatsd_* with the settings for your chosen backend (Prometheus, statsd, etc.).
Telemetry Workflow
Vault emits metrics locally → Telemetry agent collects them → Aggregation platform visualizes data: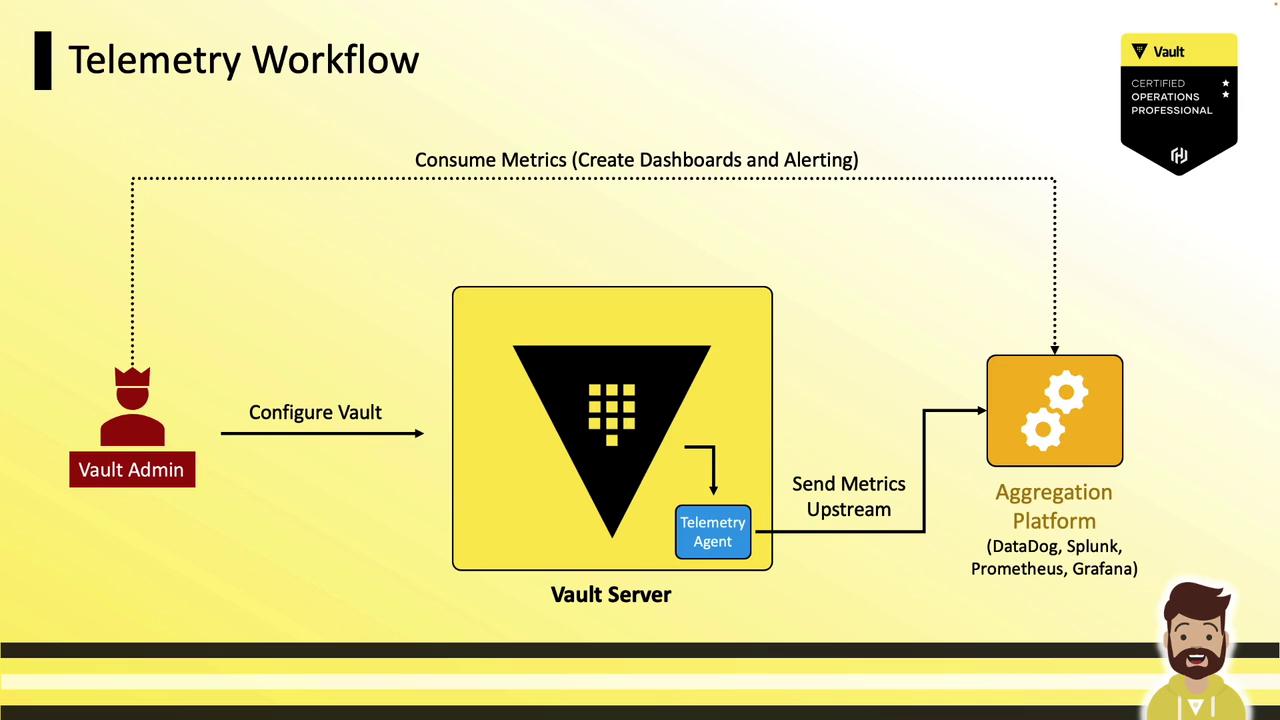
- Vault server with
telemetrystanza - Local agent (sidecar or host)
- Aggregation platform (Datadog, Splunk, Prometheus + Grafana, etc.)
- Dashboards, alerts, and capacity planning
Sample Dashboard
Below is a Datadog dashboard example showing latency, GC pauses, login rates, and storage metrics: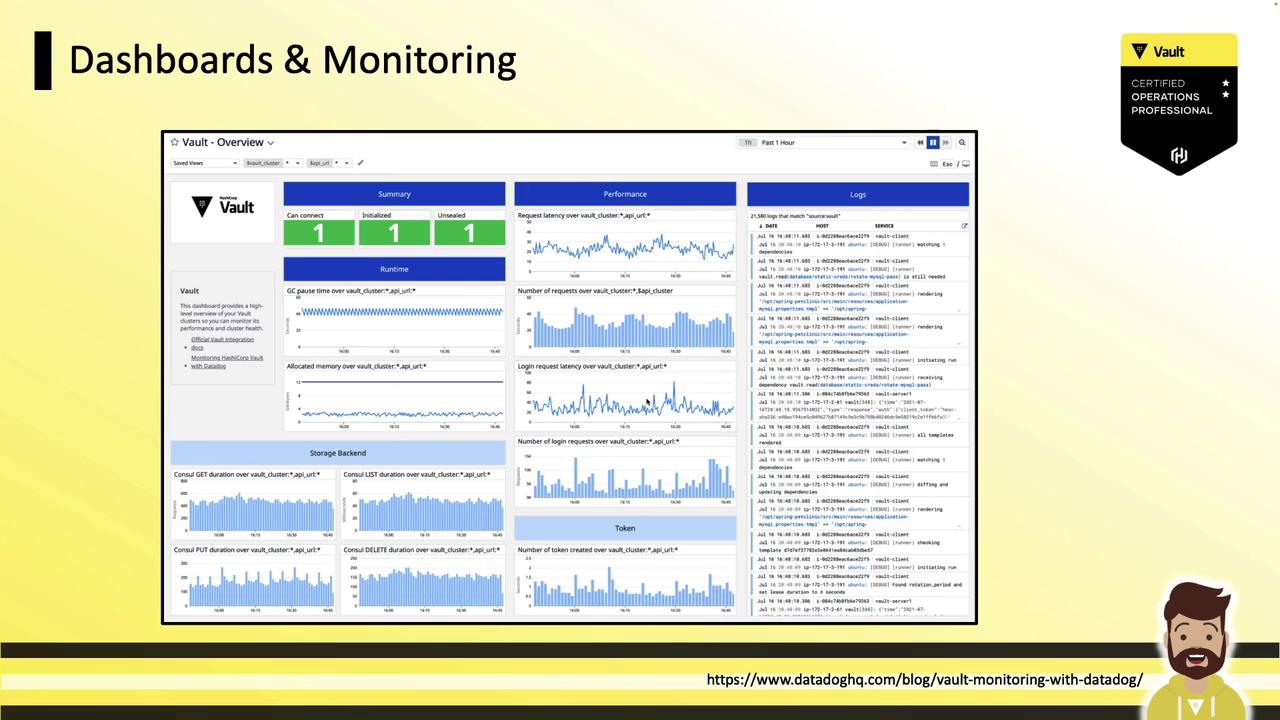
- Garbage collection pause durations
- Login request rate and P99 latency
- Token creation throughput
- Consul storage operations (put/get/delete)
Be prepared to:
- Define Vault telemetry
- Identify common metrics
- Locate the telemetry stanza in the Vault HCL config
Practical setup is unlikely, but you may be asked where to add telemetry settings.
Next up, we will explore Vault audit logs.