- Installing the Prometheus Metrics plugin in Jenkins
- Deploying Prometheus and Grafana with Docker Compose
- Scraping Jenkins metrics and querying them in Prometheus
- Visualizing data in Grafana dashboards
- Generating load in Jenkins to see real-time updates
1. Install and Configure the Prometheus Metrics Plugin in Jenkins
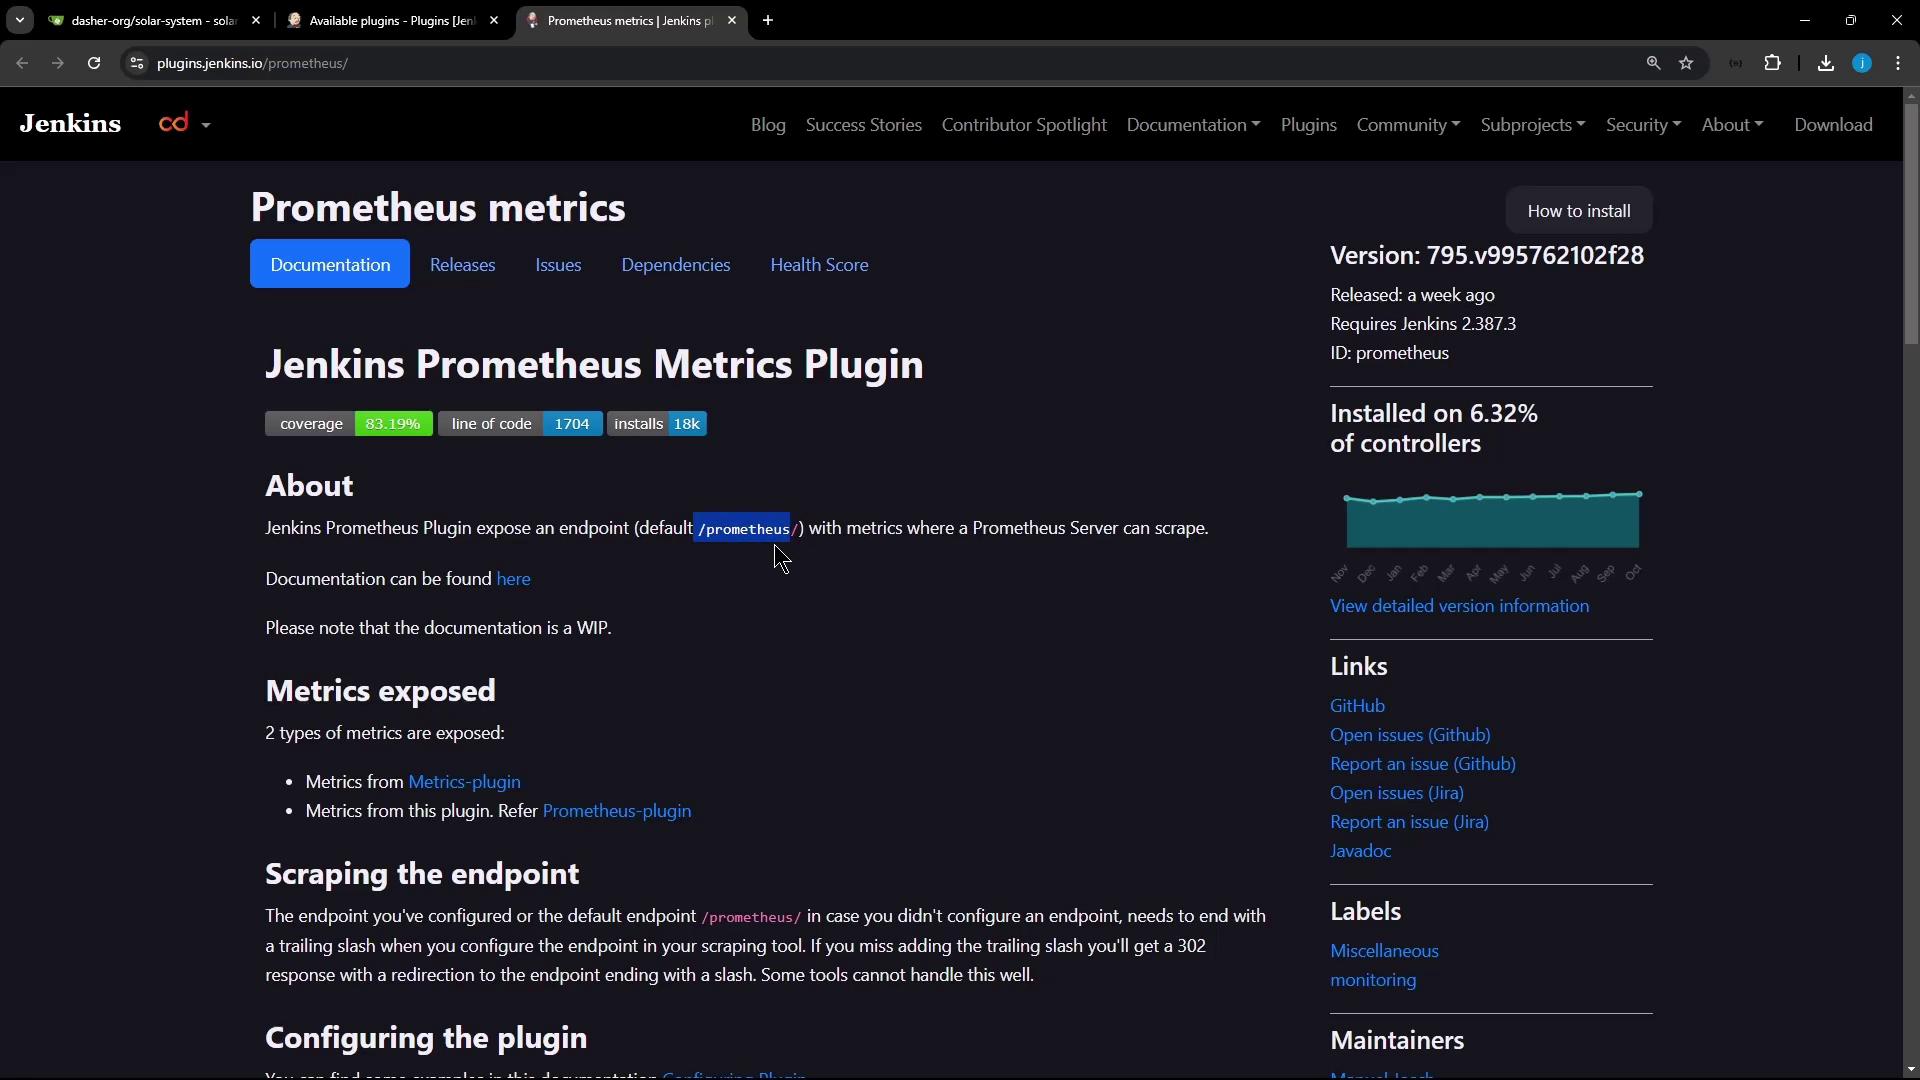
Jenkins exposes its internal metrics through the Prometheus Metrics plugin. By default, the metrics endpoint is available at/prometheus.
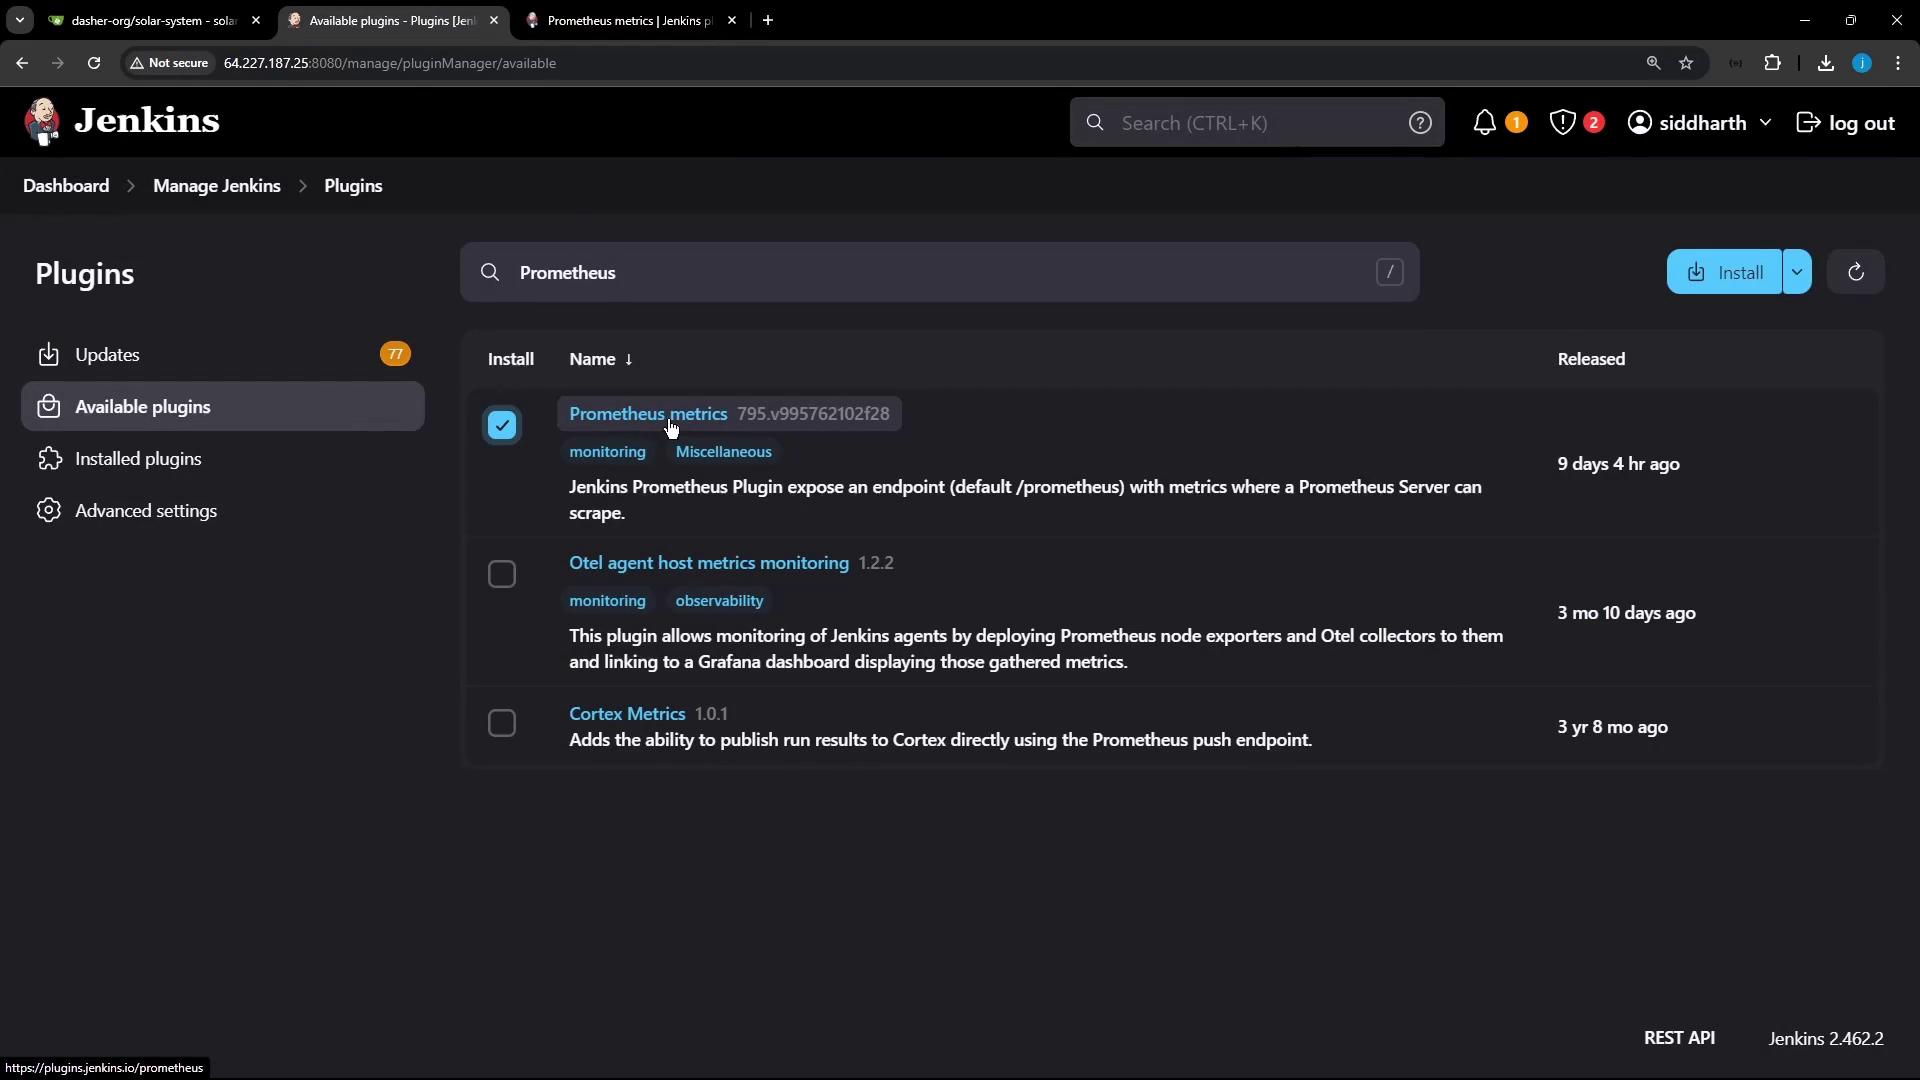
- Navigate to Manage Jenkins → Manage Plugins.
- In the Available tab, search for and install Prometheus Metrics Plugin.
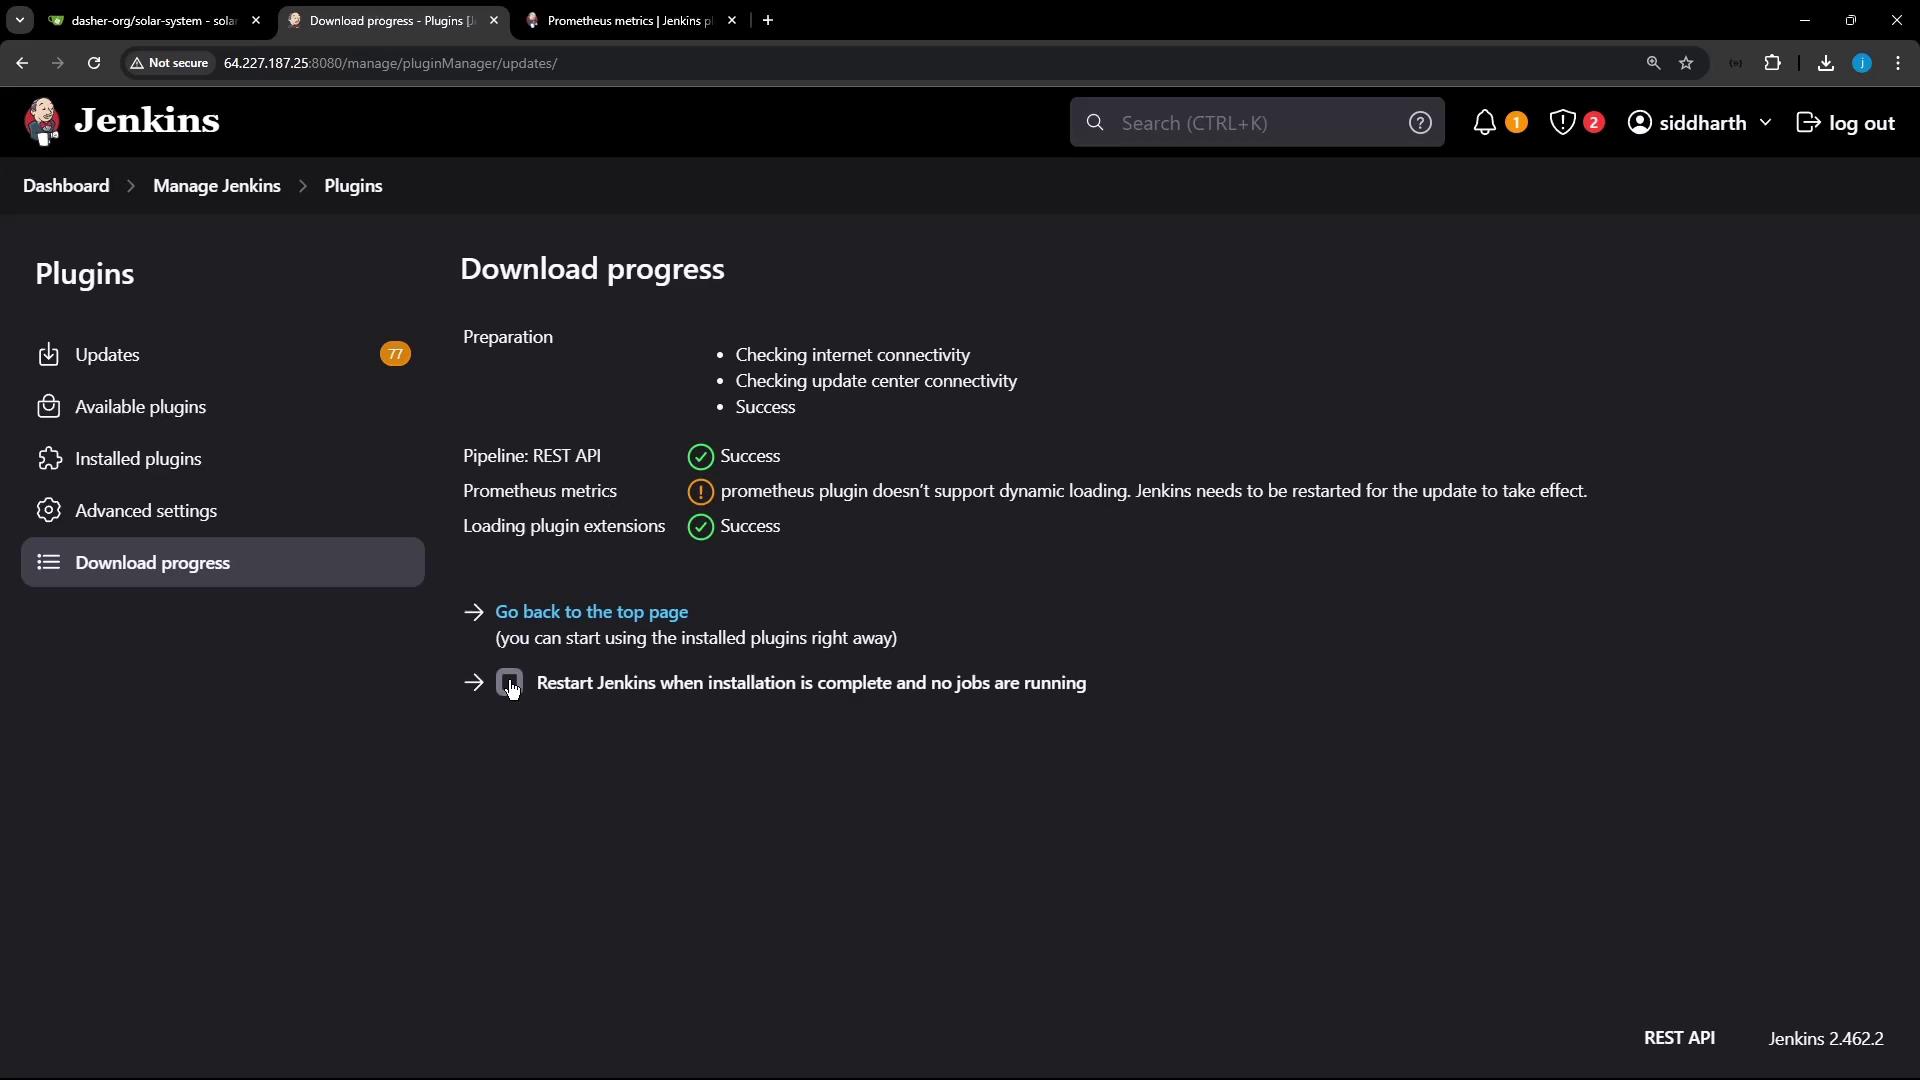
- Restart Jenkins when prompted.
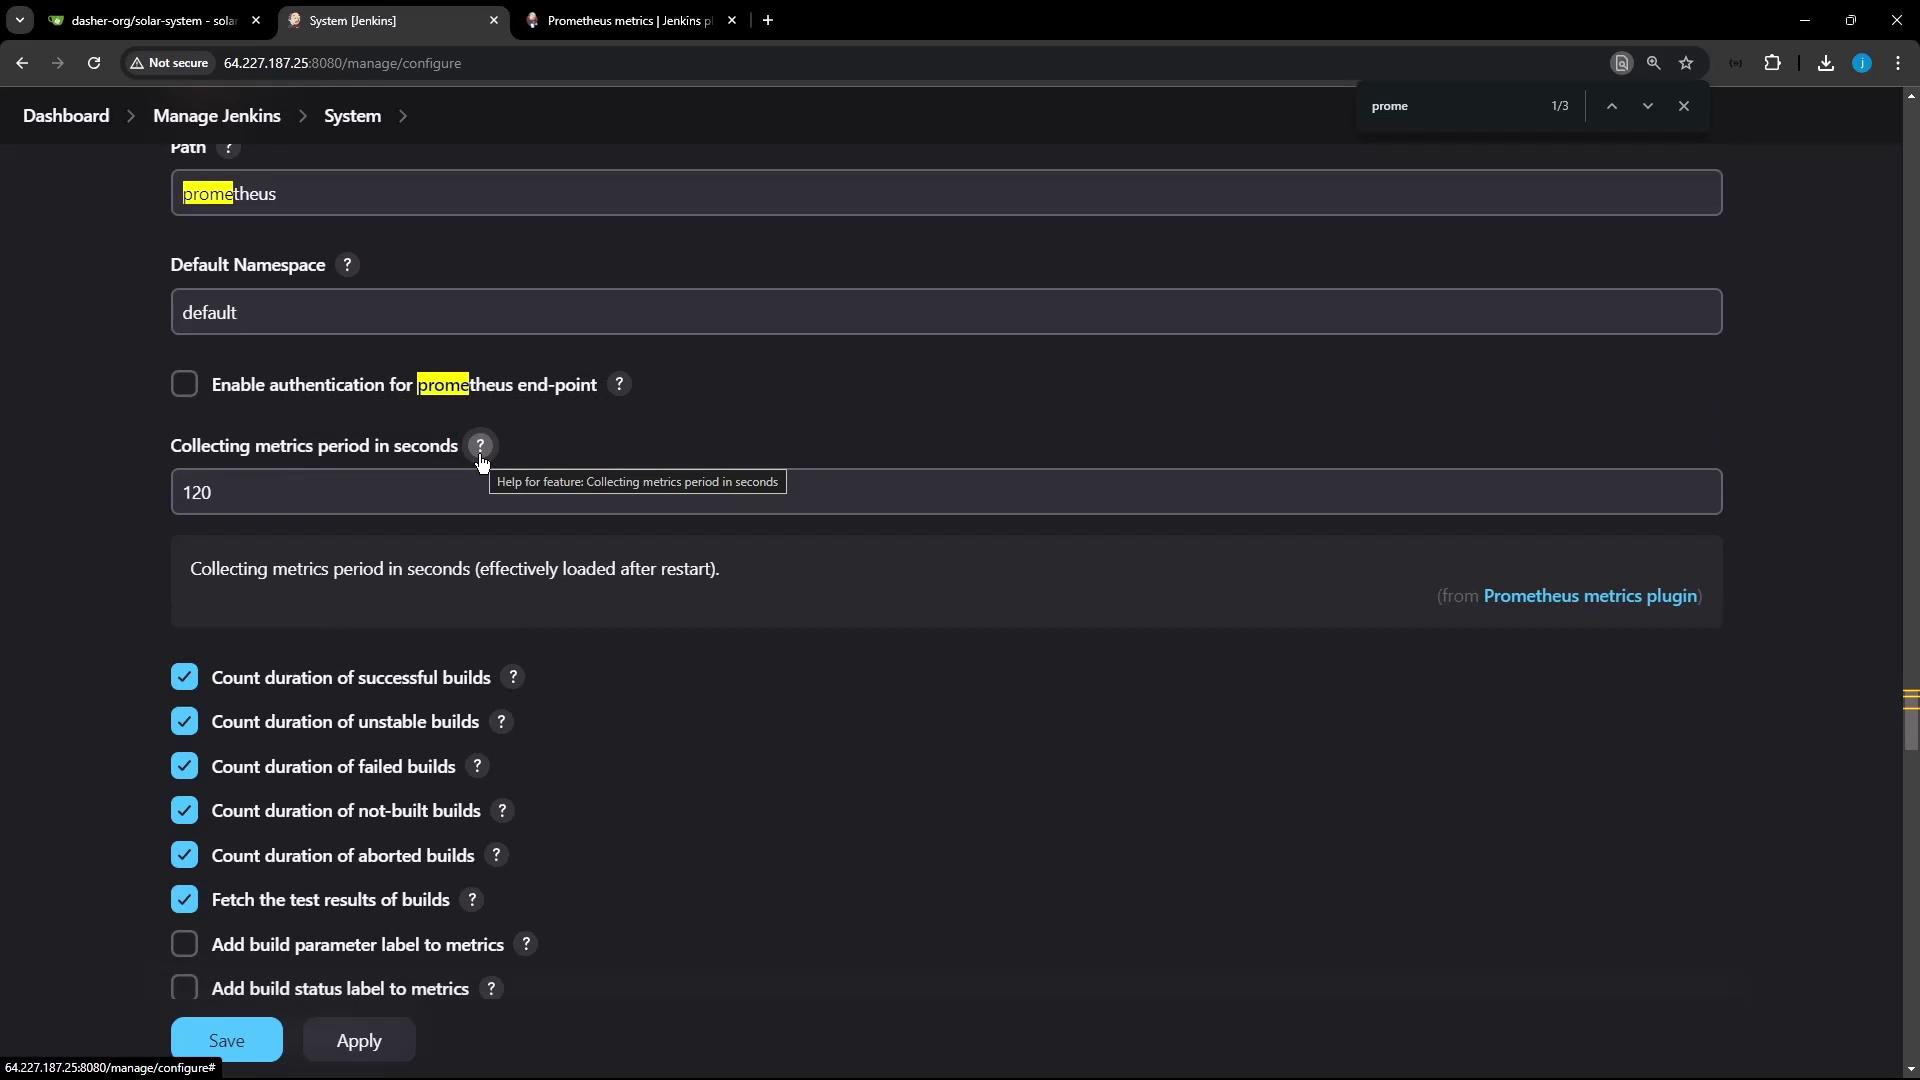
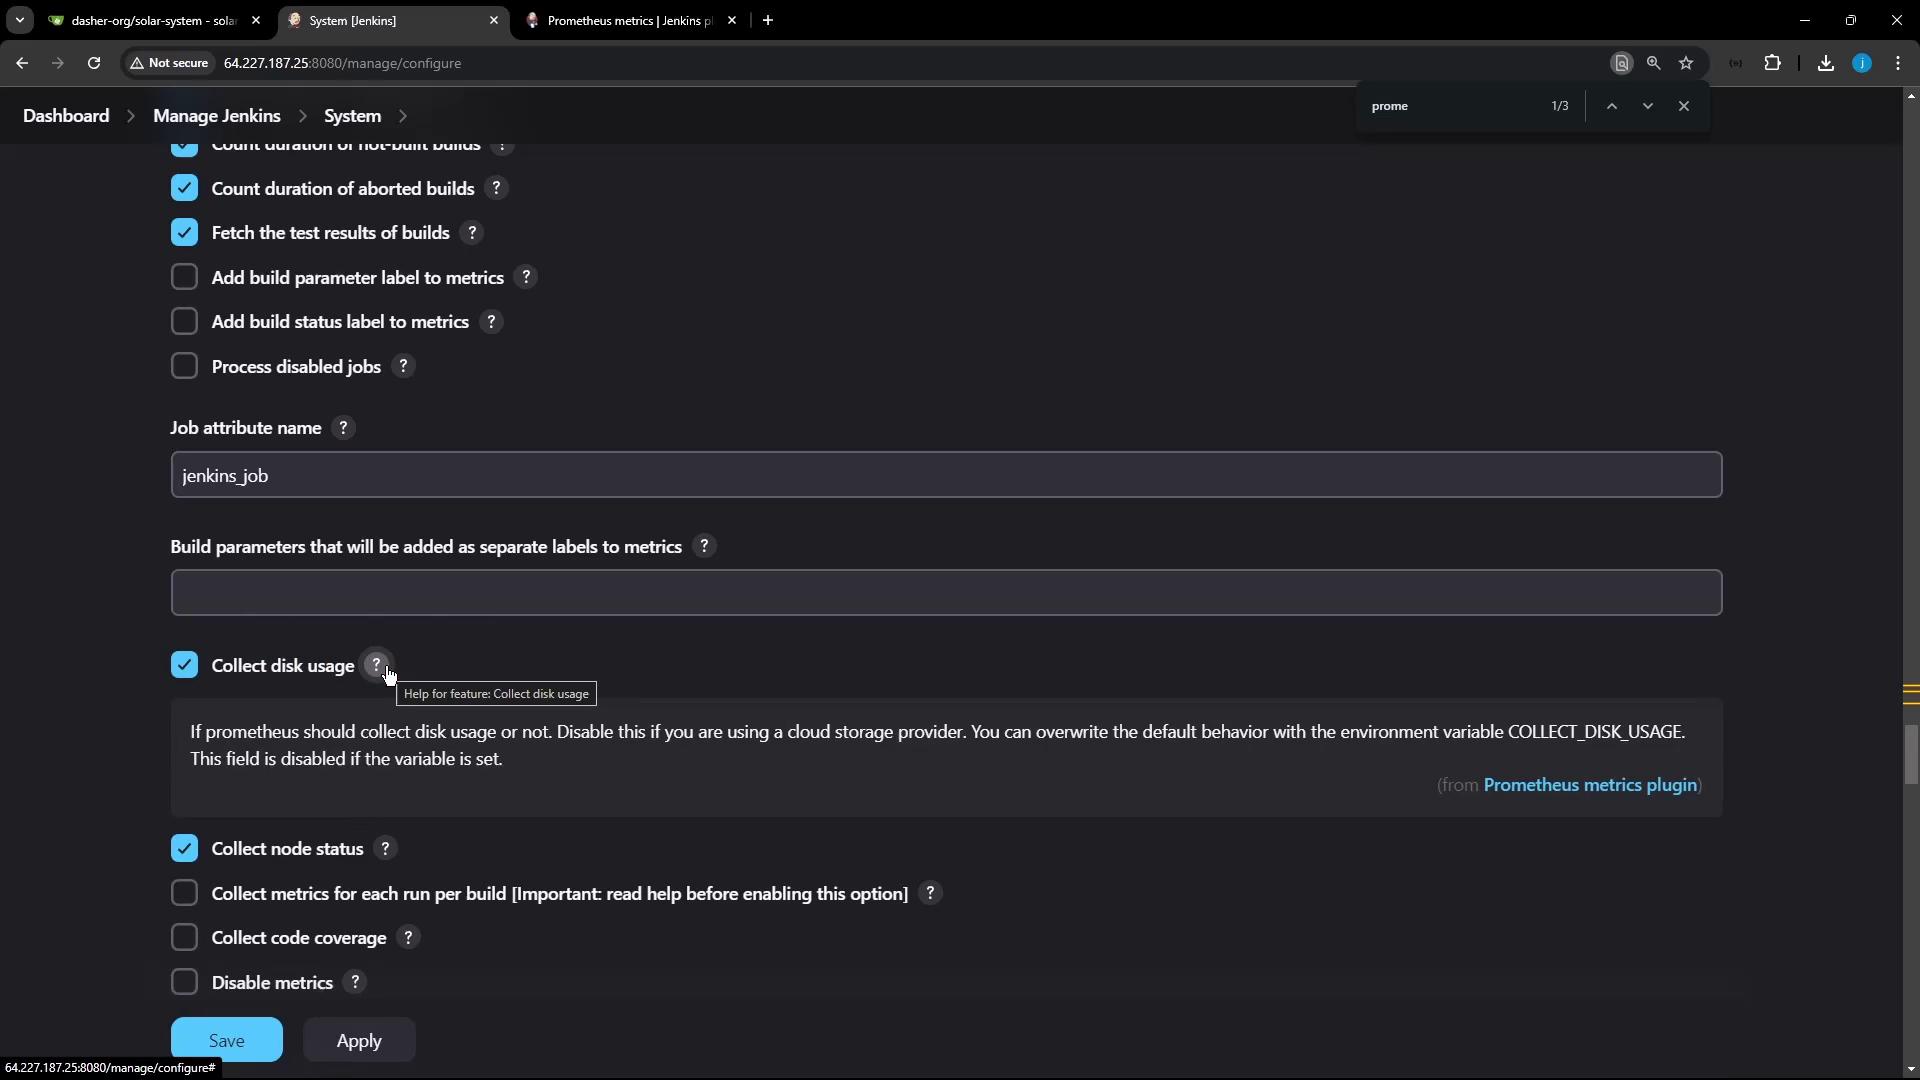
- Go to Manage Jenkins → Configure System and search for Prometheus.
- Set Metrics collection interval to 10 seconds (default is 120s).
- Disable Disk Usage if you haven’t installed the CloudBees Disk Usage plugin.
- Leave other options at their defaults and note the endpoint path:
/prometheus.
Disabling Disk Usage metrics avoids extra overhead if you’re not using the CloudBees plugin.
2. Deploy Prometheus and Grafana using Docker Compose
Create adocker-compose.yml in your project root to launch Prometheus (port 9090) and Grafana (port 8081):
The default Grafana credentials are admin/password. Change them in production by setting
GF_SECURITY_ADMIN_USER and GF_SECURITY_ADMIN_PASSWORD to secure values.3. Configure Prometheus to Scrape Jenkins
Editprometheus/prometheus.yml to add a jenkins job:
<JENKINS_HOST>:<JENKINS_PORT> with your Jenkins URL (e.g., jenkins.example.com:8080).
4. Launch the Monitoring Stack
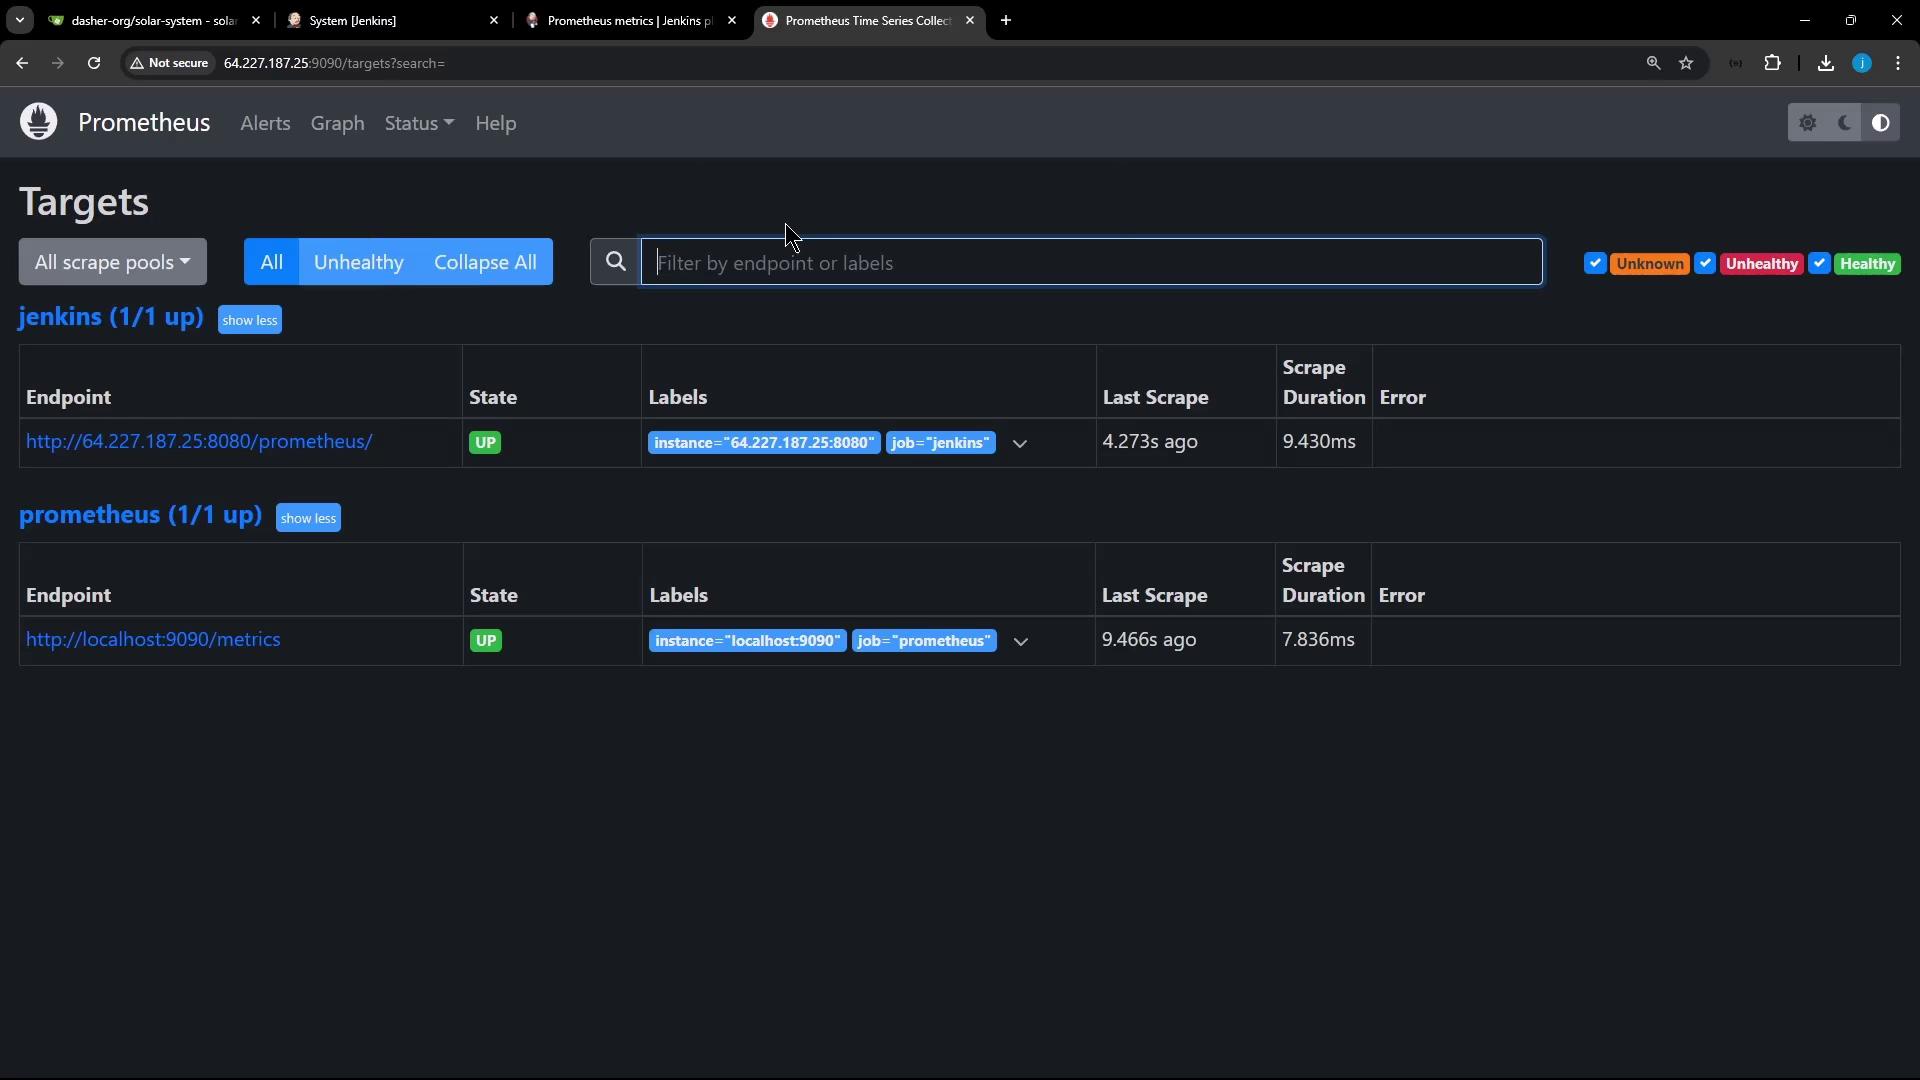
5. Verify Jenkins Target in Prometheus
Openhttp://<VM_IP>:9090, then go to Status → Targets. You should see both prometheus and jenkins targets listed as UP.
6. Explore Jenkins Metrics with Prometheus
Use Prometheus → Graph to run queries. For example:| Metric | Description | Query |
|---|---|---|
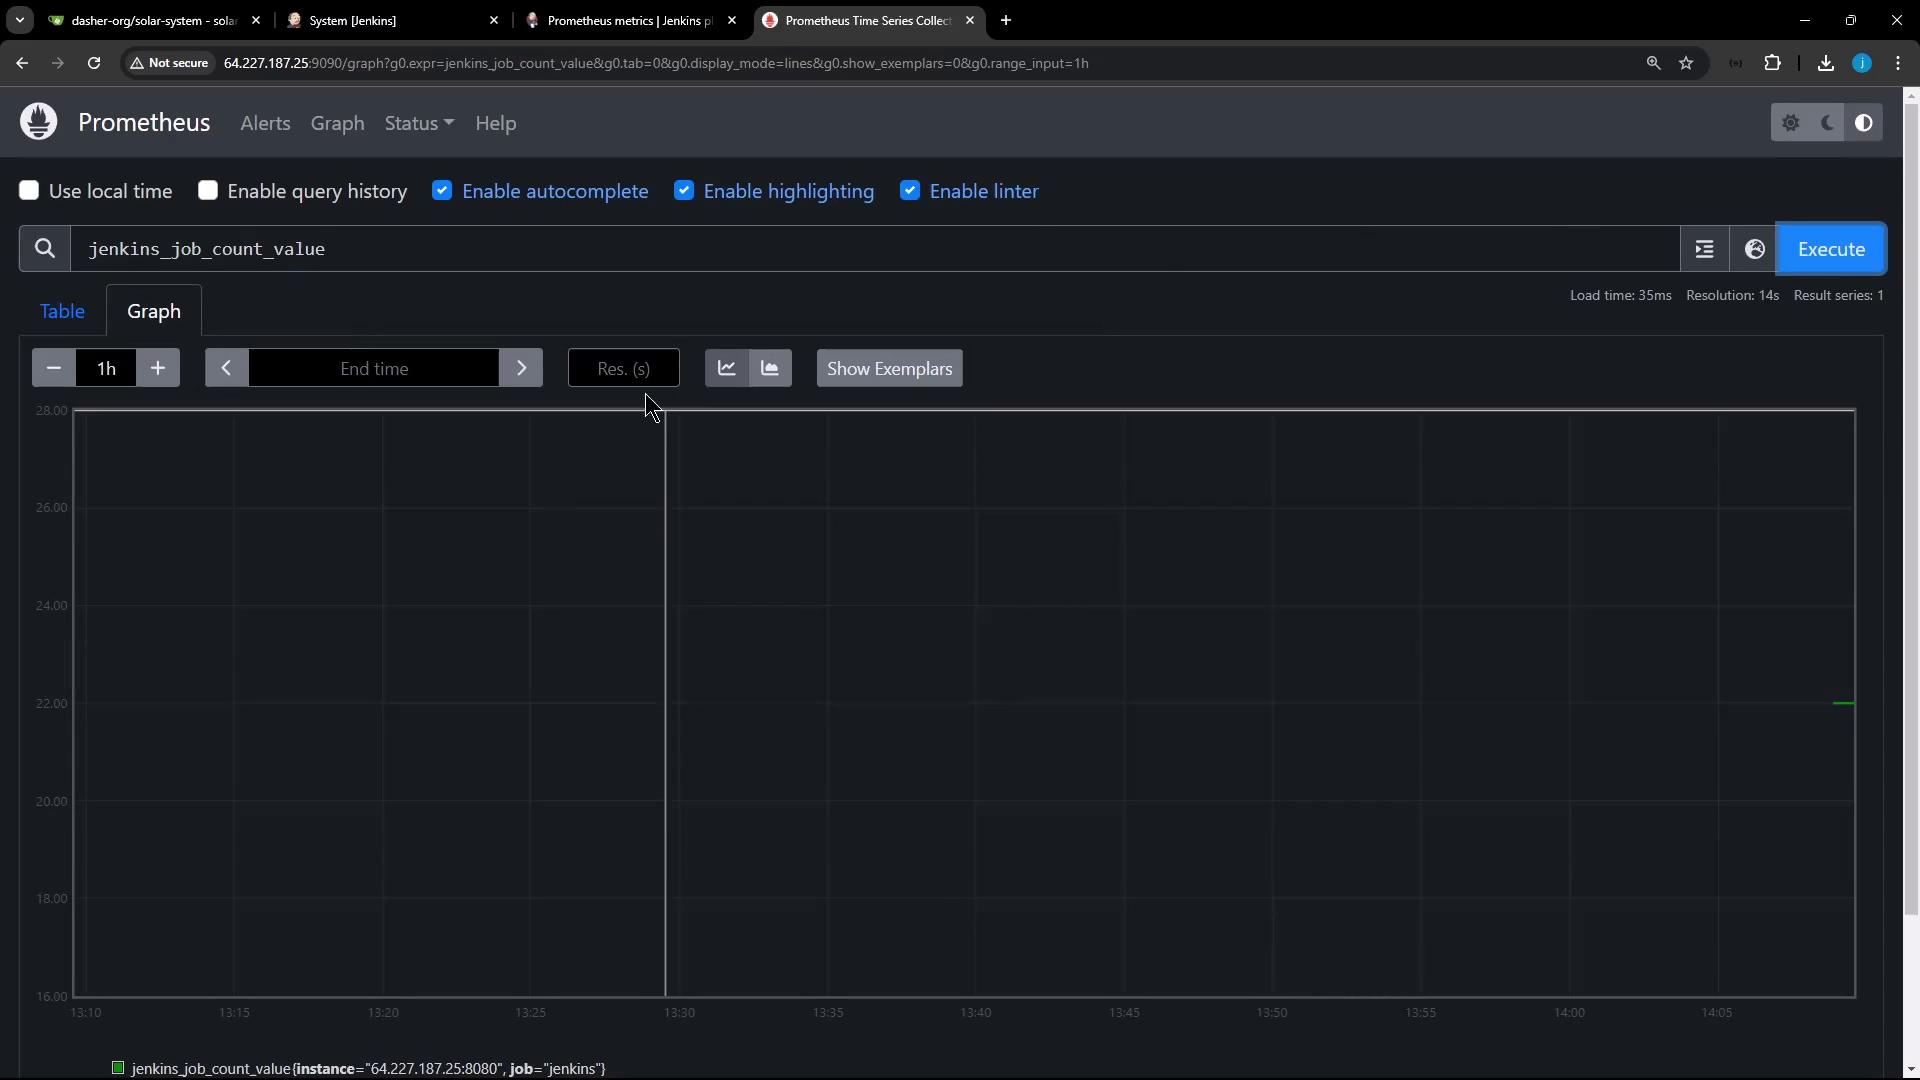
| jenkins_job_count_value | Total number of Jenkins jobs | jenkins_job_count_value |
| jenkins_plugins_active | Count of active plugins | jenkins_plugins_active |
| jenkins_plugins_withUpdate | Plugins that have updates available | jenkins_plugins_withUpdate |
- Type
jenkins_in the Expression field to see available metrics.
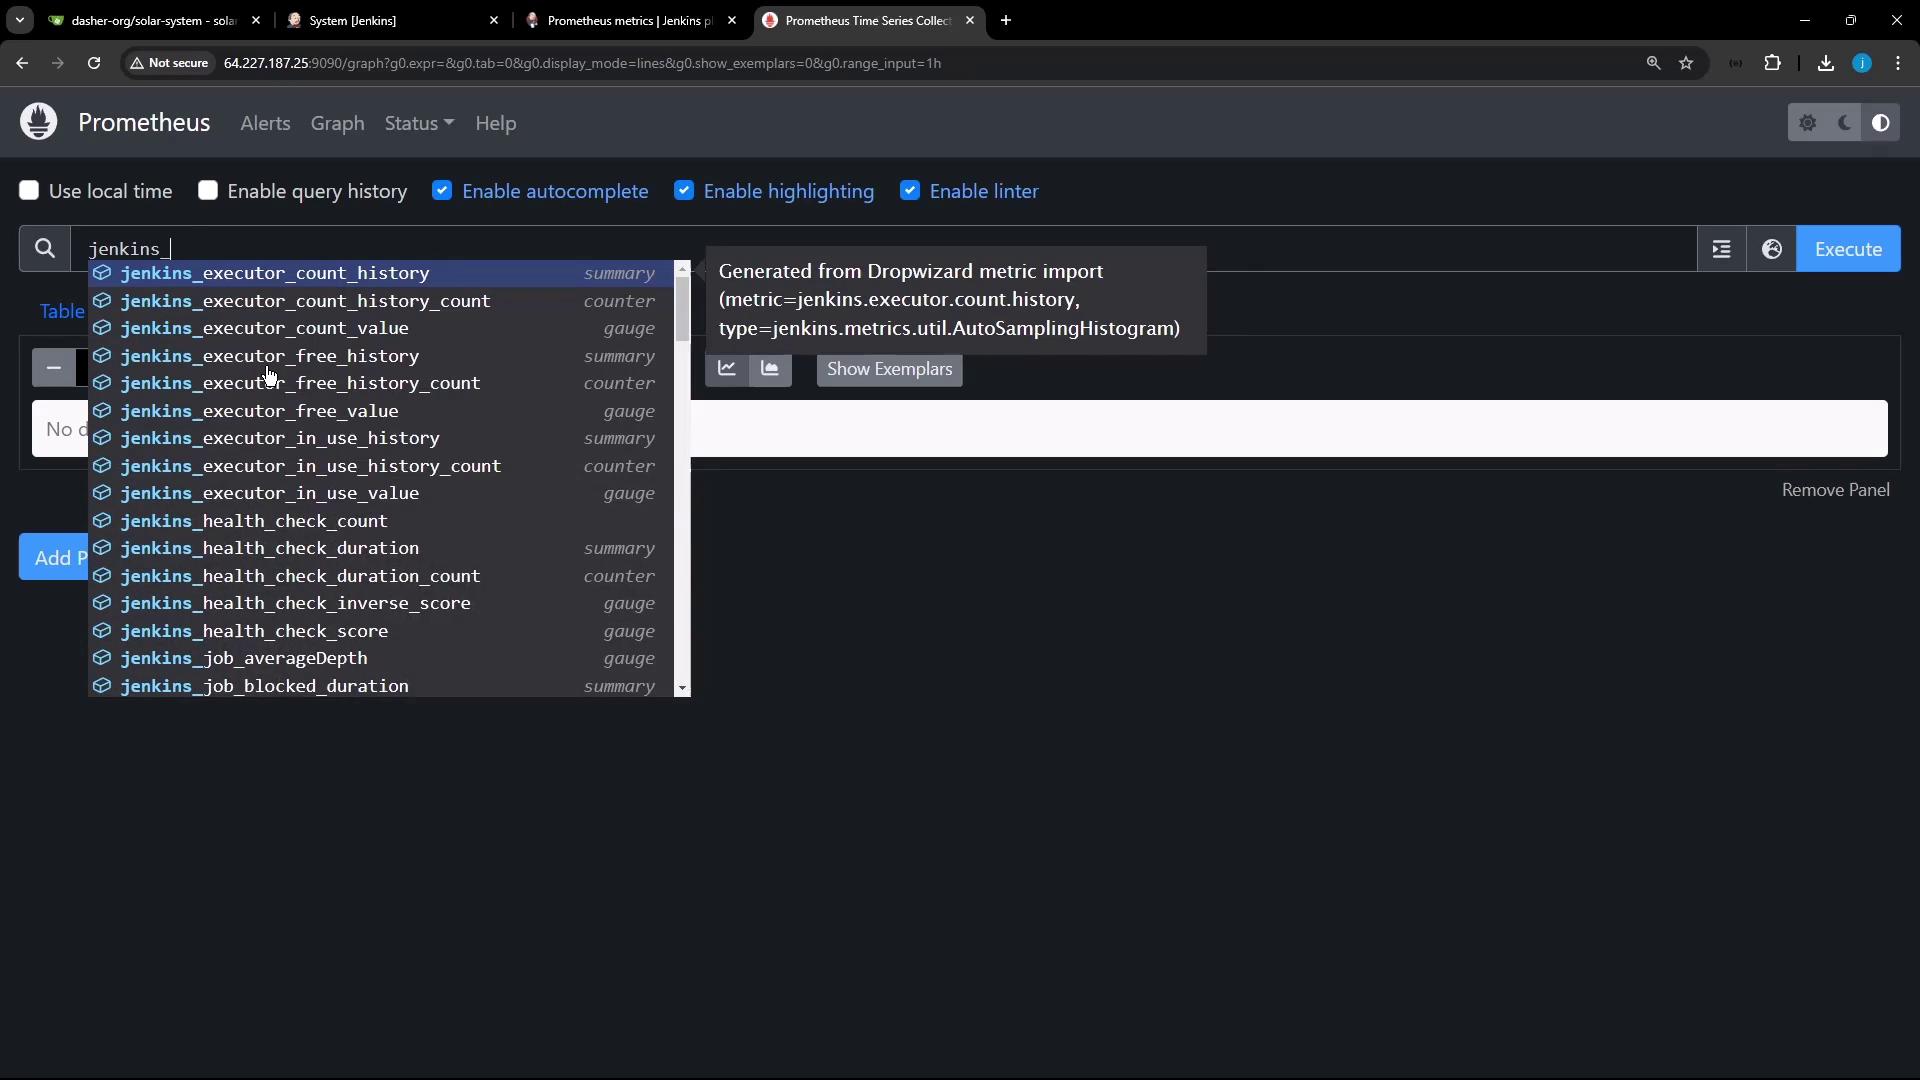
- Plot a metric over time:
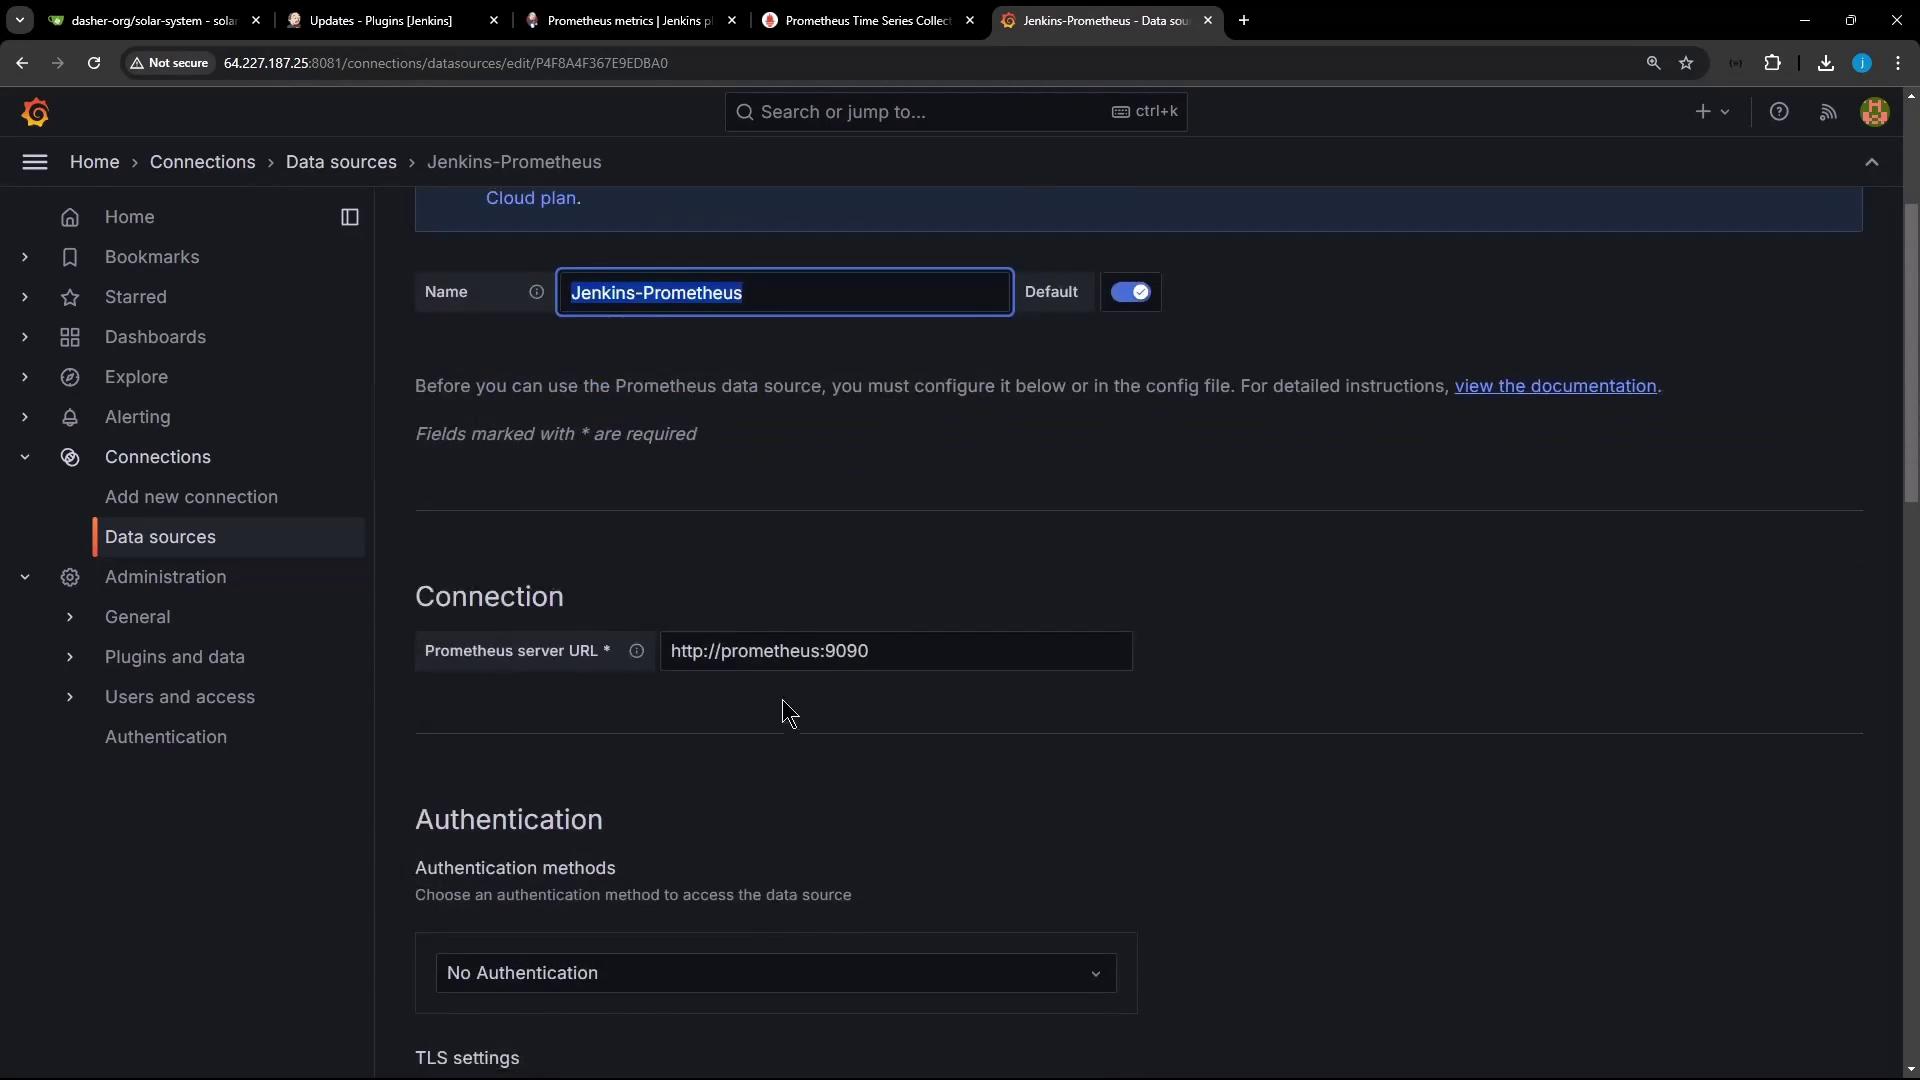
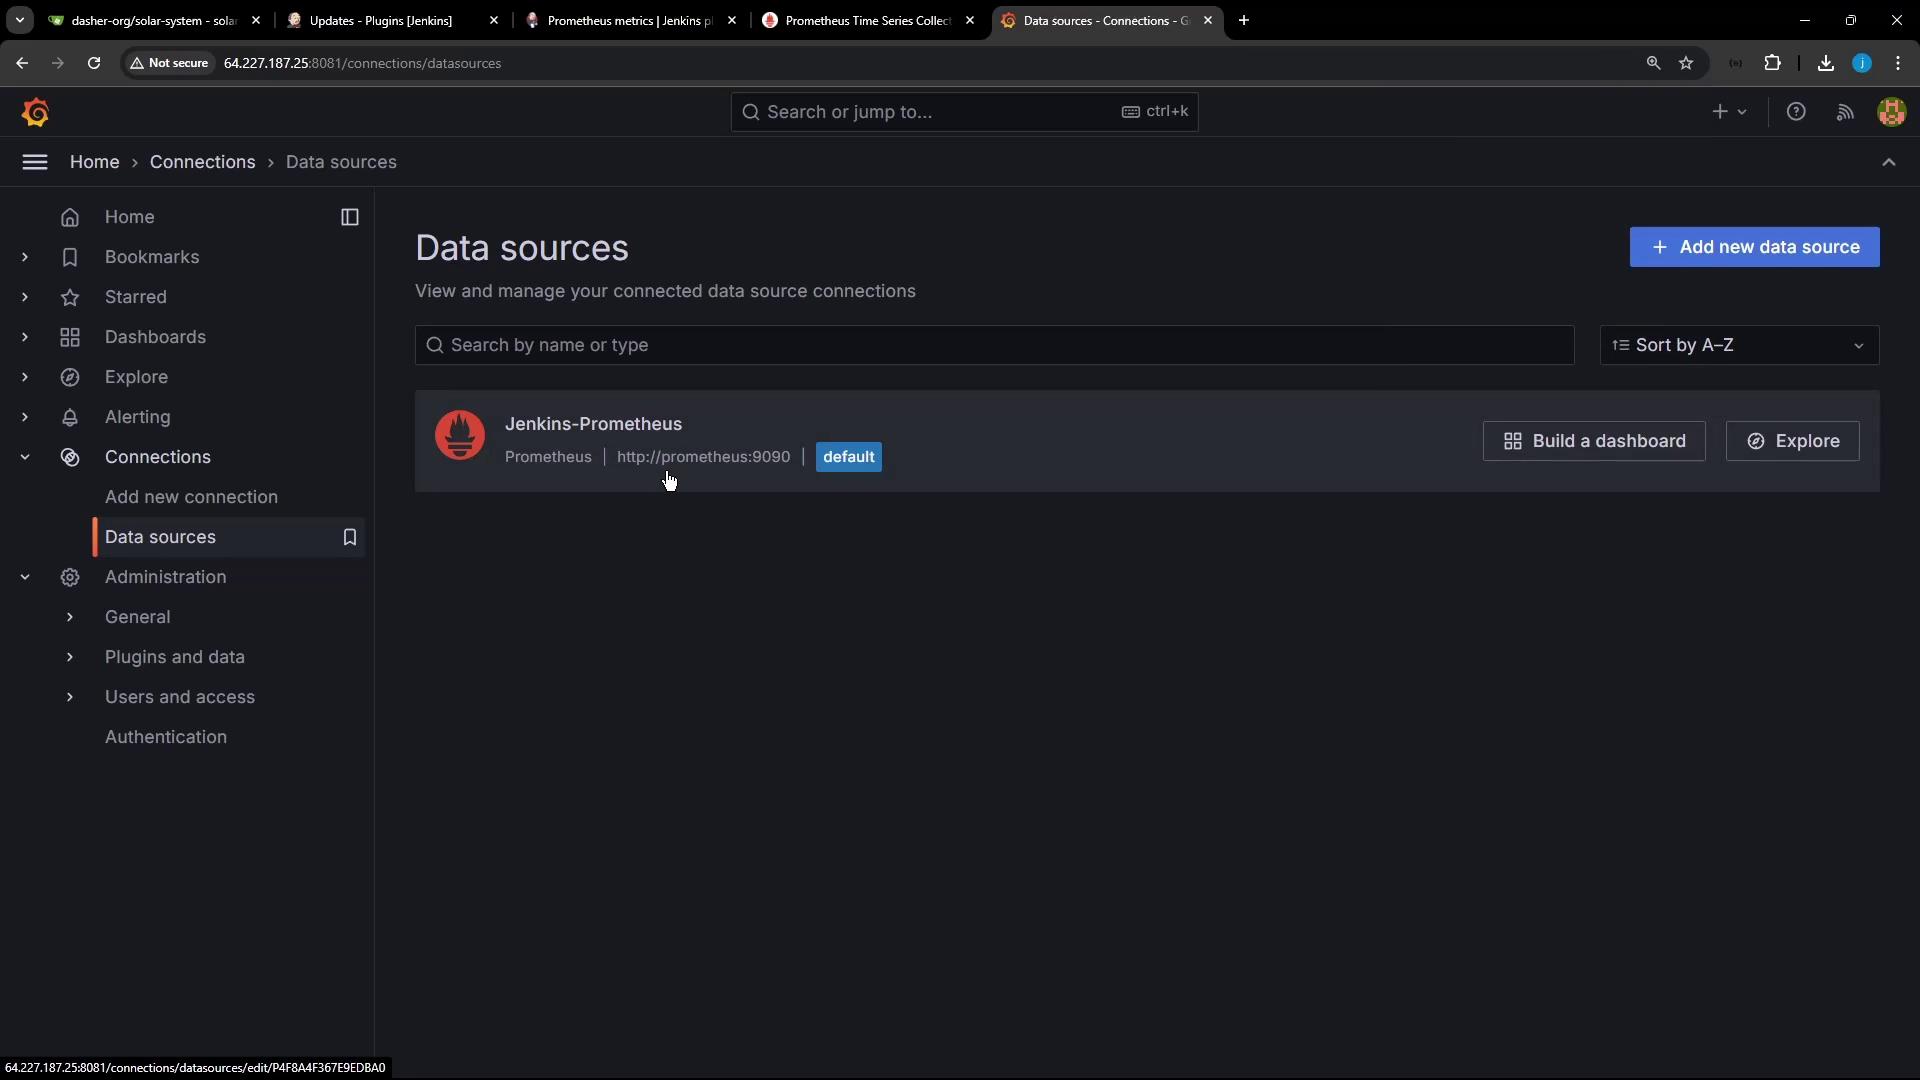
7. Add Prometheus Data Source in Grafana
- Visit
http://<VM_IP>:8081and log in (admin/password). - Go to Configuration → Data Sources → Add data source → Prometheus.
- Set URL to
http://prometheus:9090(or your host URL). - Click Save & Test.
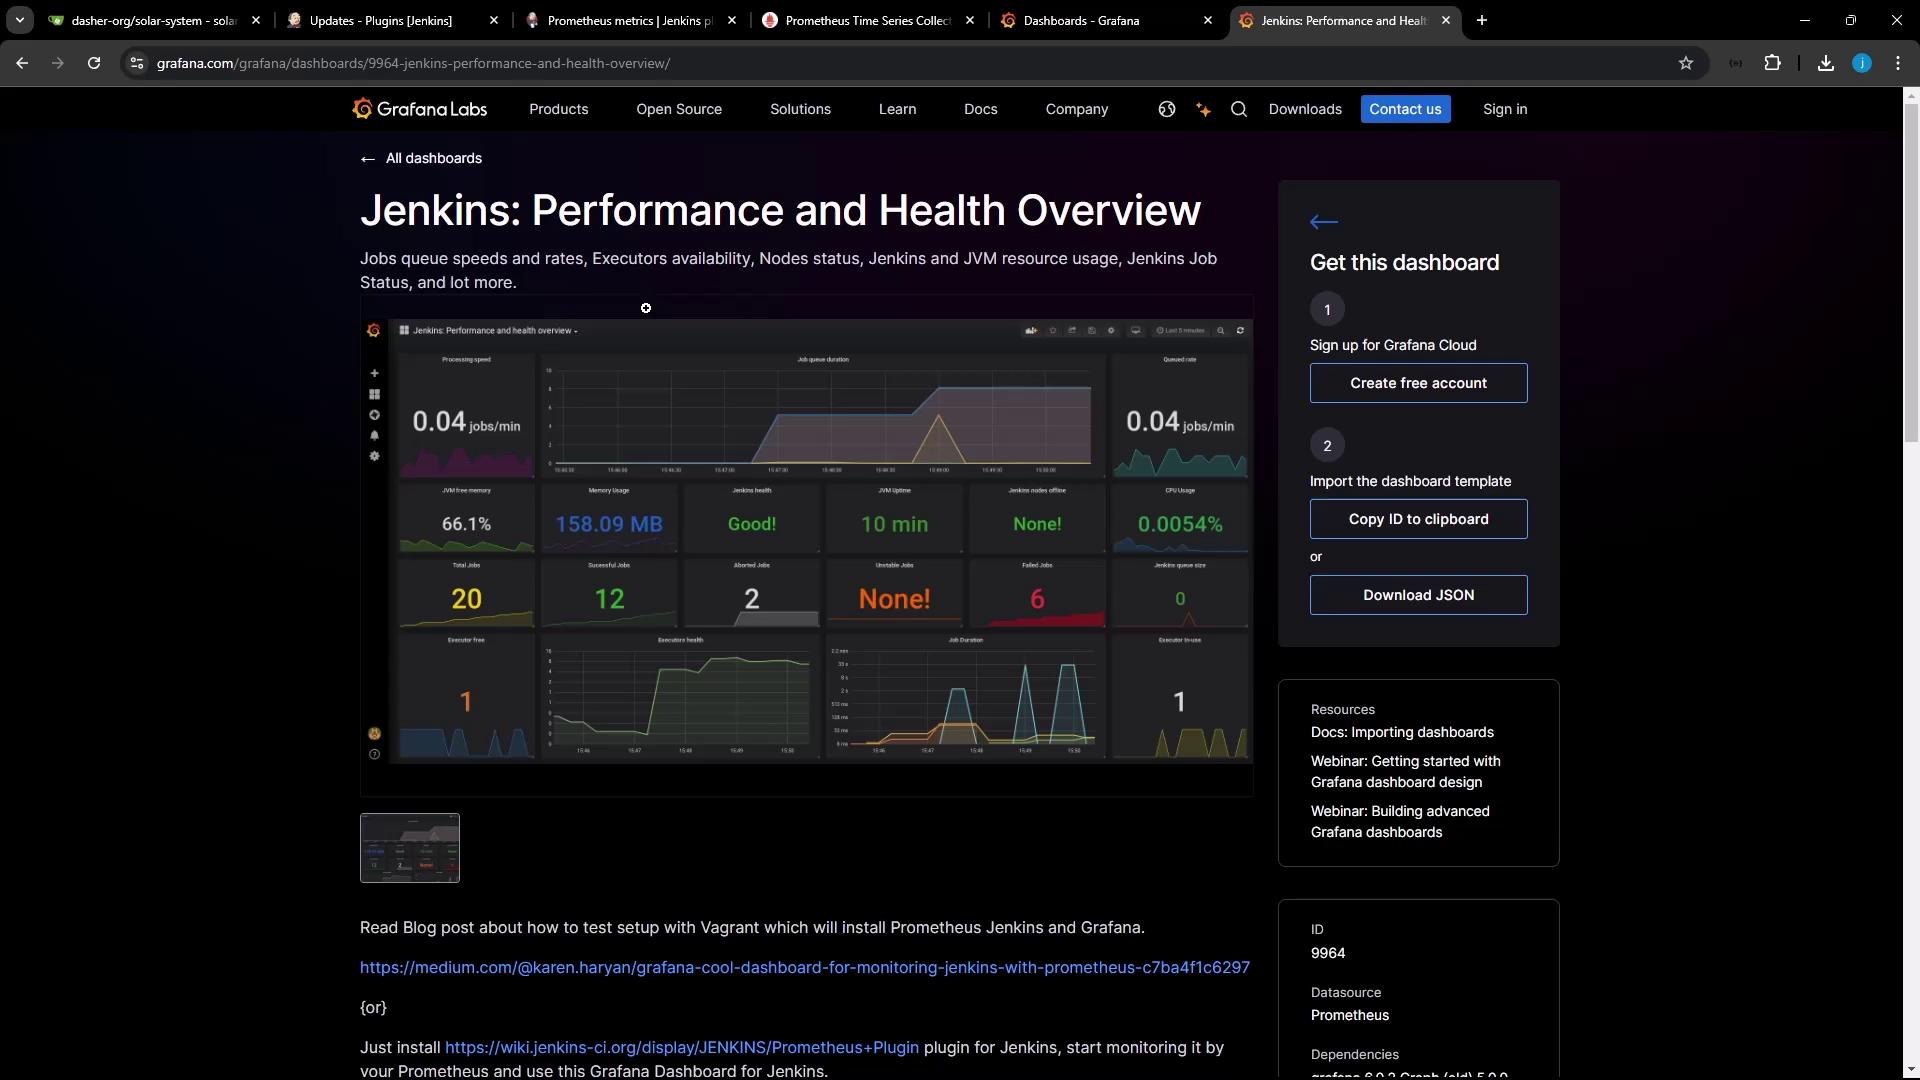
8. Import a Jenkins Dashboard in Grafana
Grafana’s dashboard repository includes prebuilt Jenkins dashboards. We’ll import Jenkins Performance & Health Overview (ID 9964):- In Grafana, click Create → Import.
- Enter 9964 and click Load.
- Select your Jenkins-Prometheus data source and click Import.
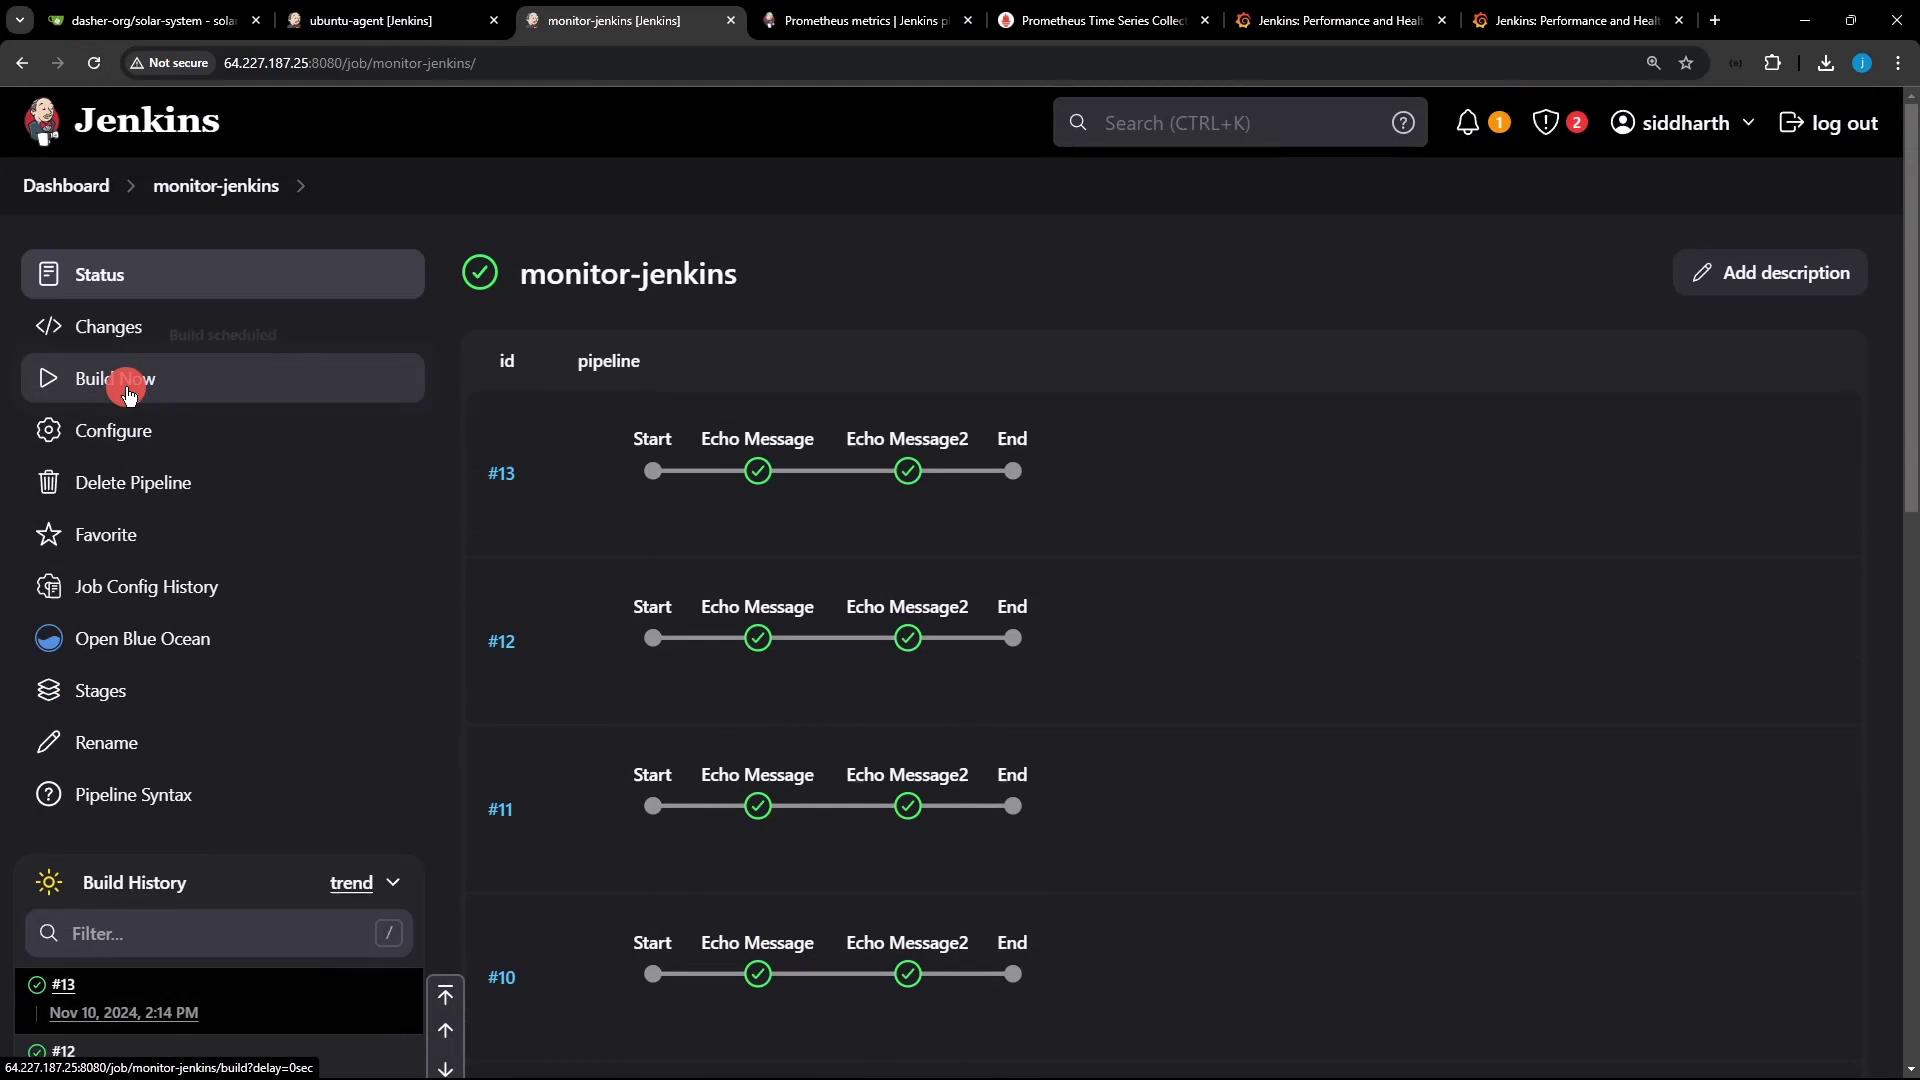
9. Generate Build Activity in Jenkins
To populate your dashboards with data, create a simple Pipeline that sleeps and echoes:- In Jenkins, click New Item → Pipeline, name it monitor-jenkins, then OK.
-
Under Pipeline → Definition, choose Pipeline script and paste:
- Save and run Build Now ~20 times.
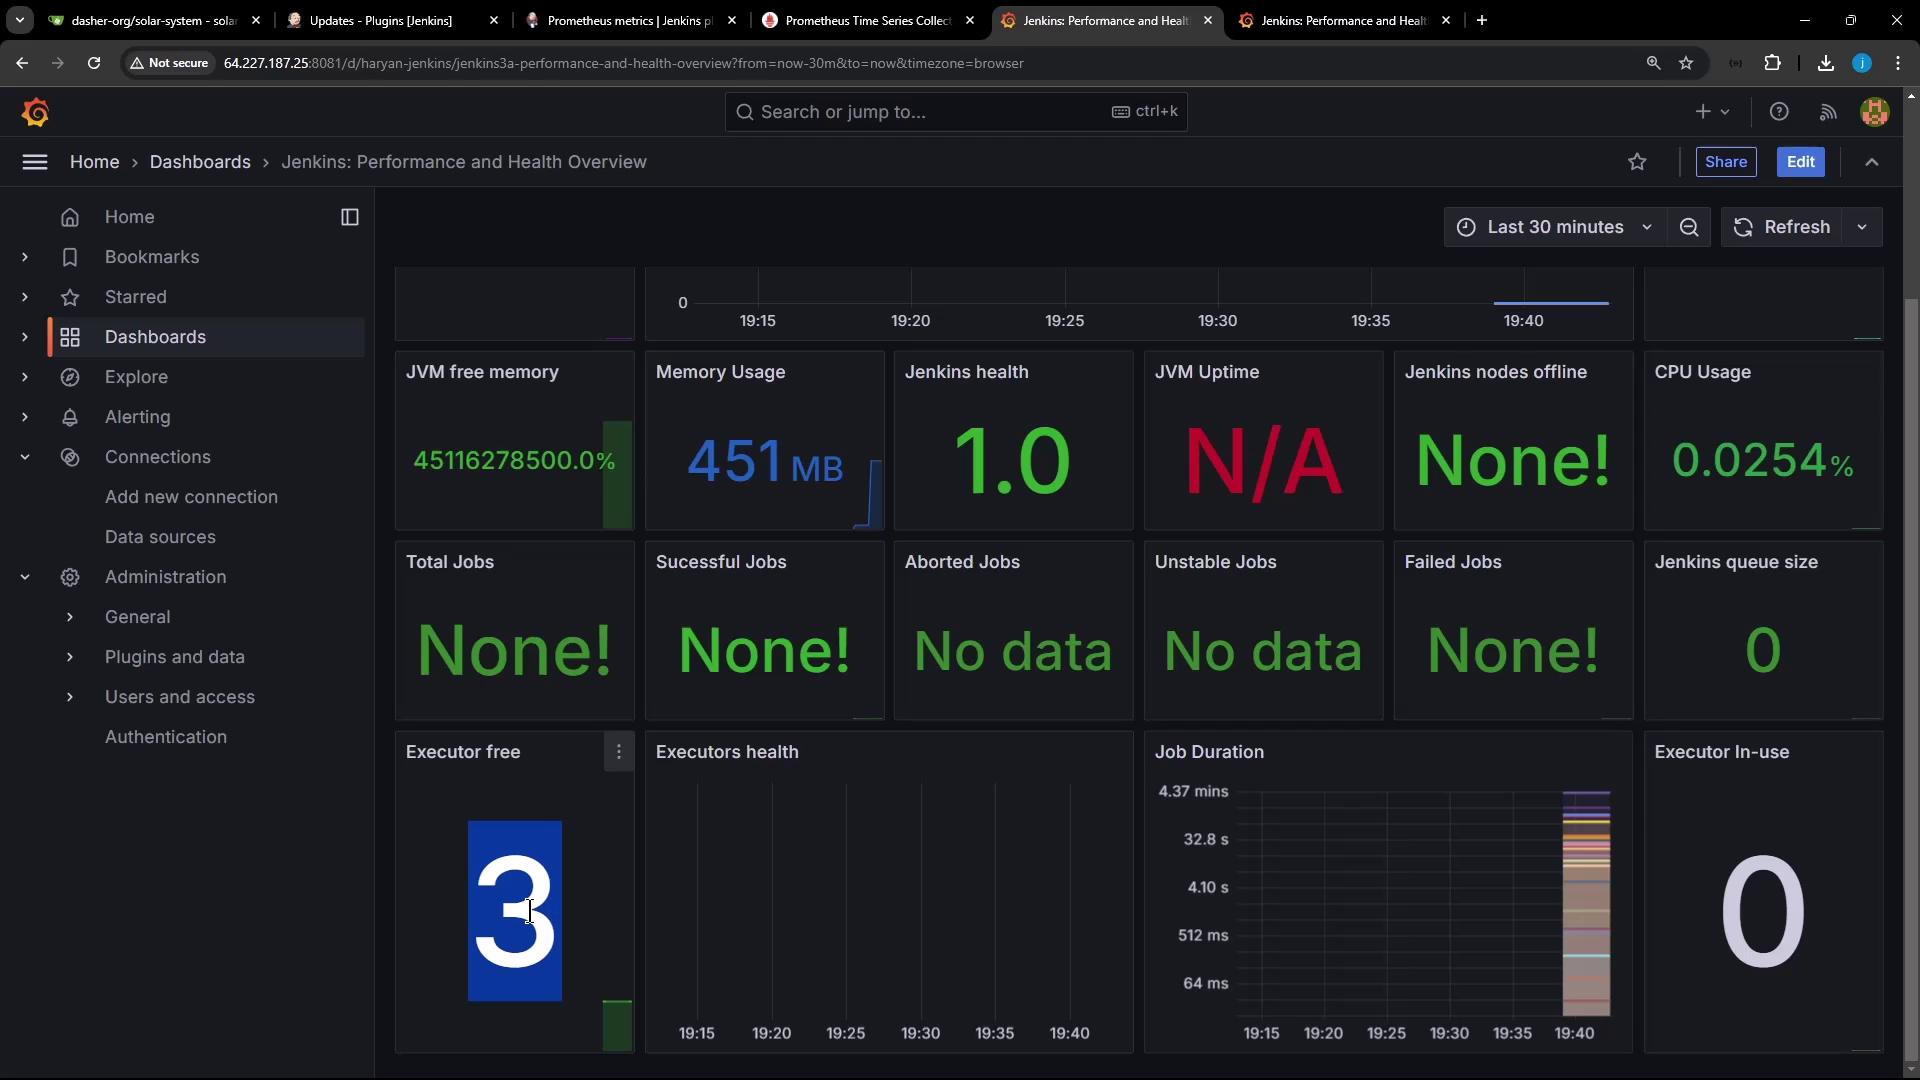
10. Visualize Real-Time Metrics in Grafana
After a few minutes, refresh your Grafana dashboard. You’ll see metrics for queue rate, processing speed, executor usage, and more updating live.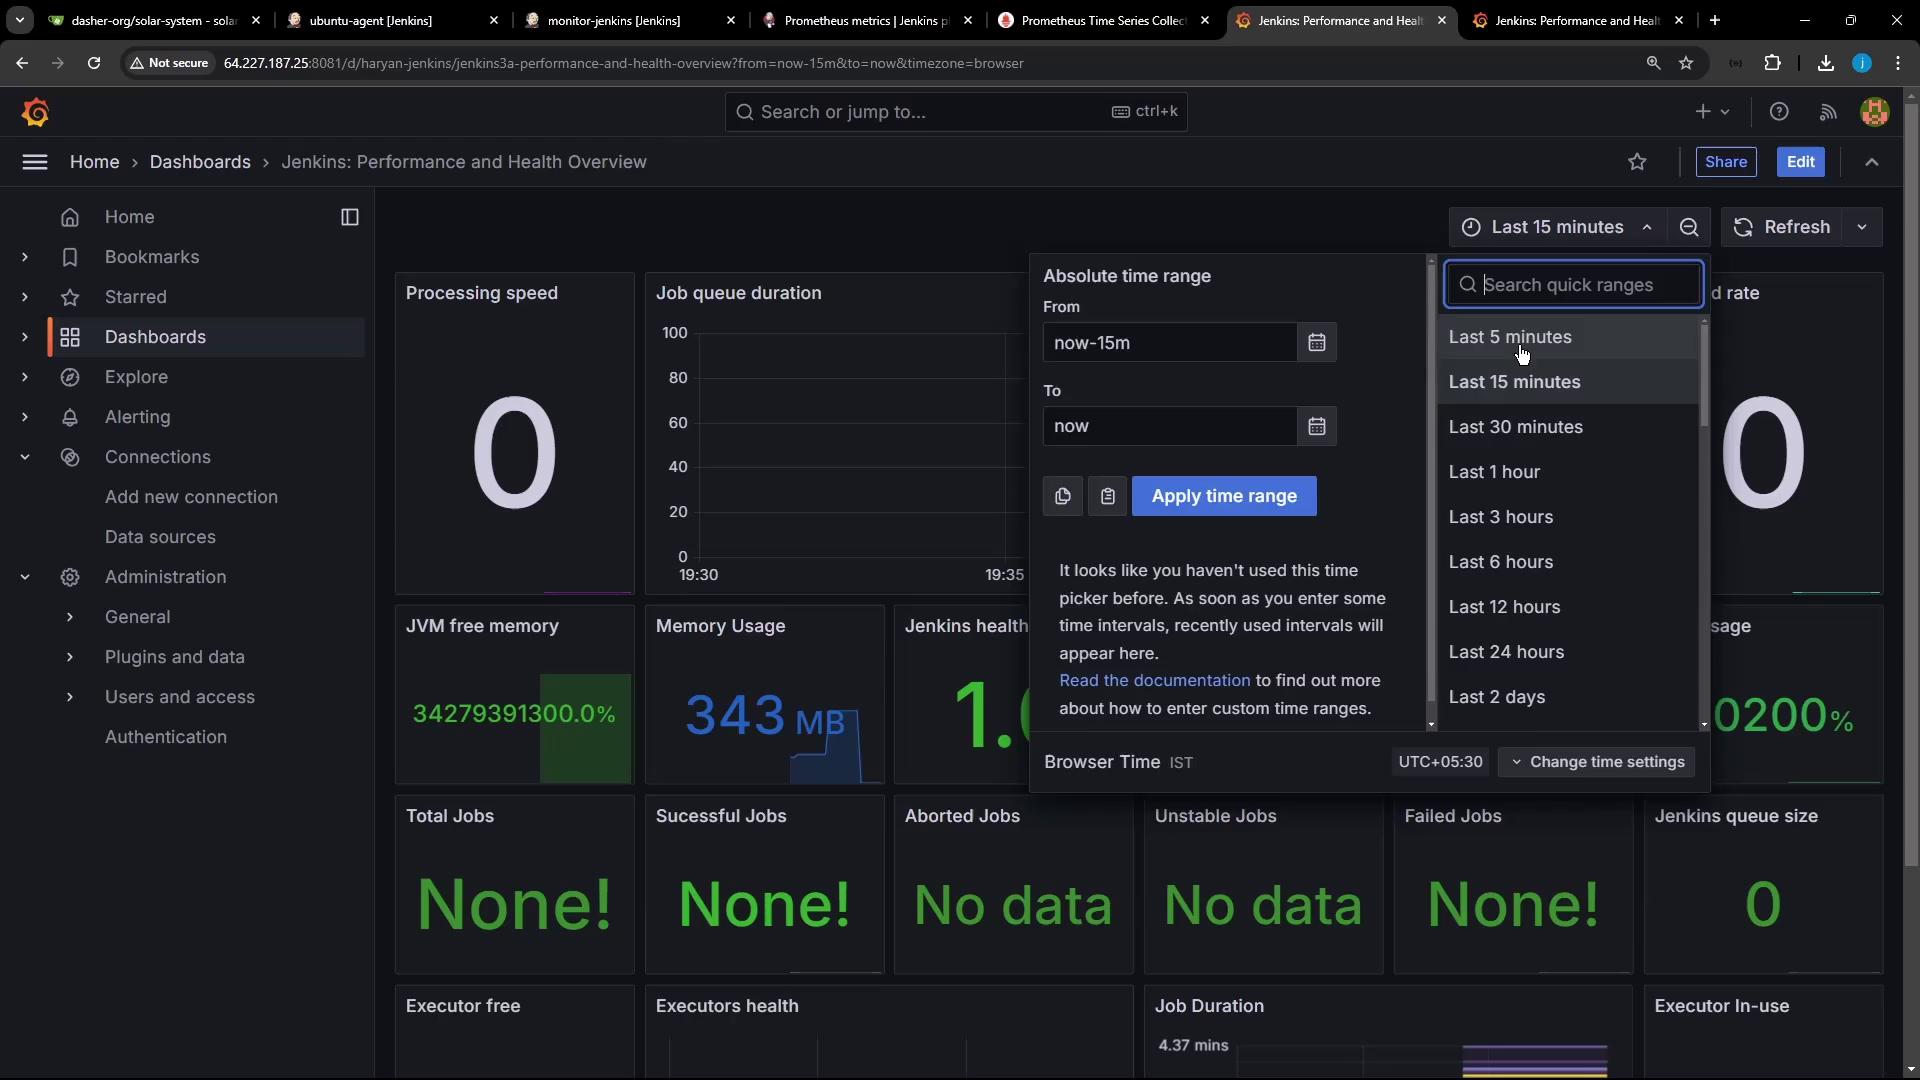
You’ve successfully set up a robust monitoring stack for Jenkins using Prometheus and Grafana. With this integration, you gain deep insights into build performance, system health, and resource trends. Explore additional dashboards, custom PromQL alerts, and Grafana panels to tailor your CI/CD observability.