1. Elastic Cloud: Collect and Analyze Logs
First, sign in to your Elastic Cloud account and navigate to Observability » Collect and Analyze Logs. This onboarding flow walks you through creating an API key and preparing the Elastic Agent for log collection.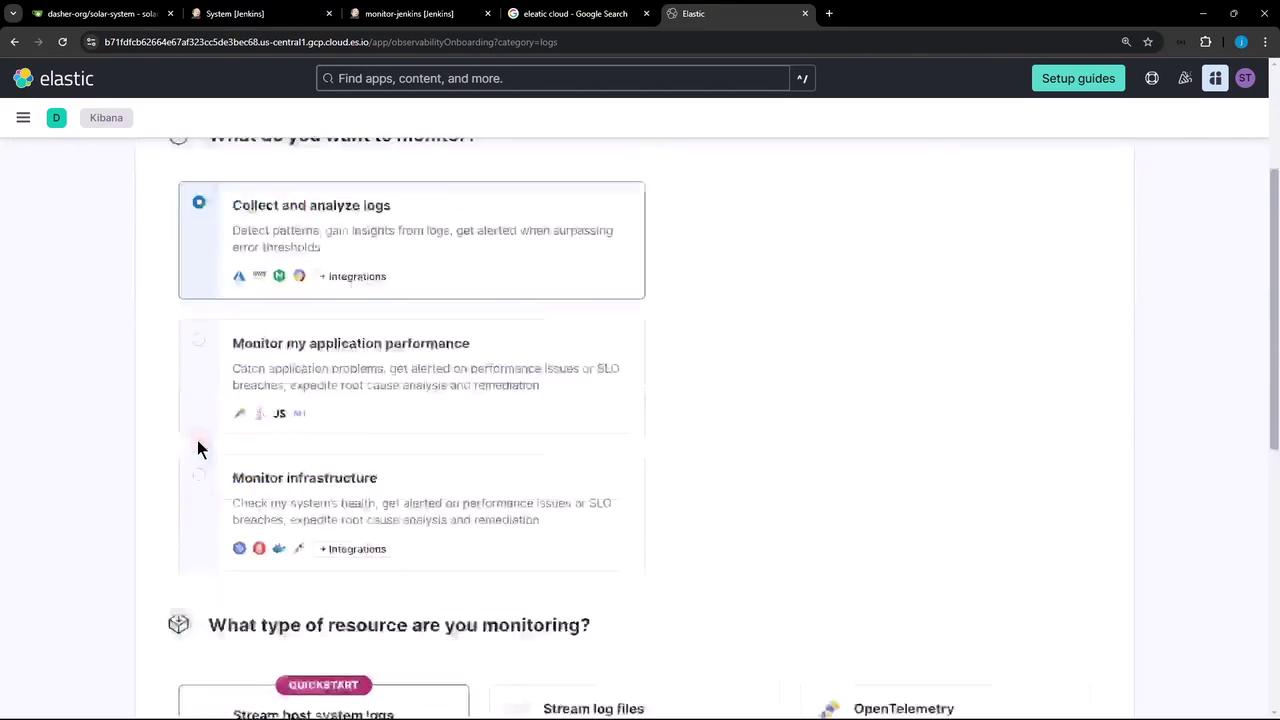
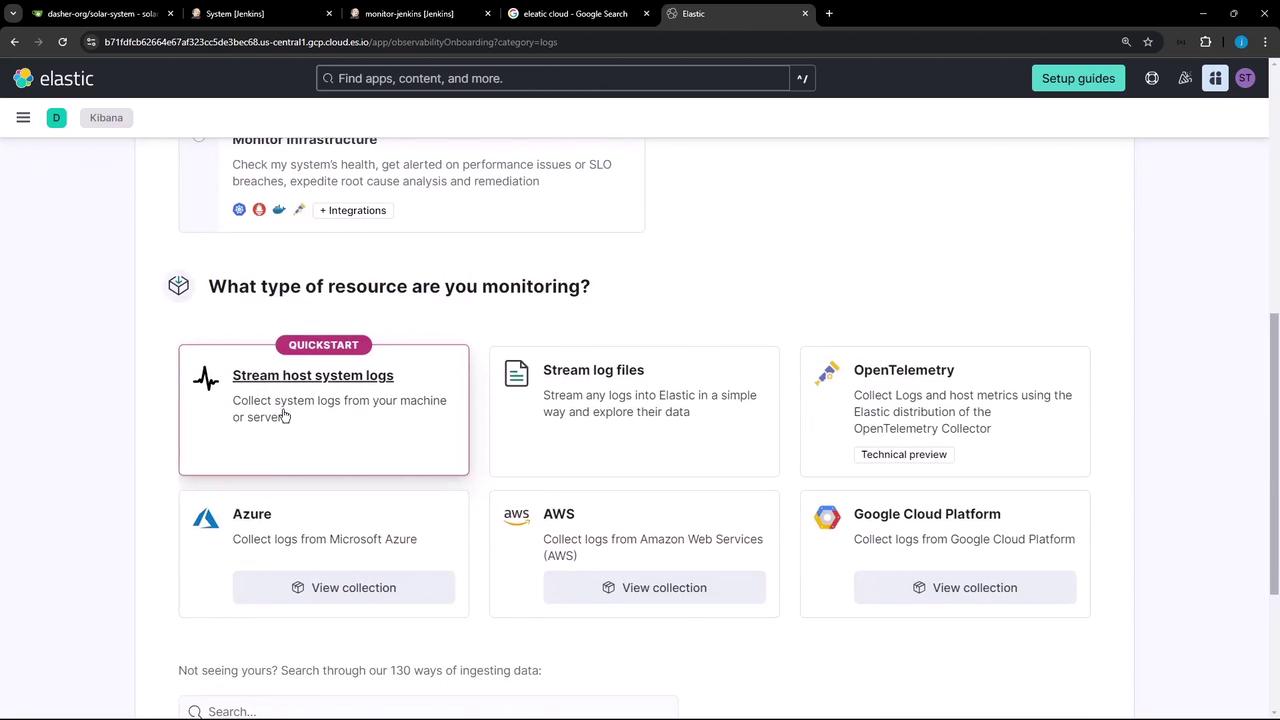
- Click Host system logs under Resource Type.
- Copy the generated API key and endpoint URL; you’ll need these in the next step.
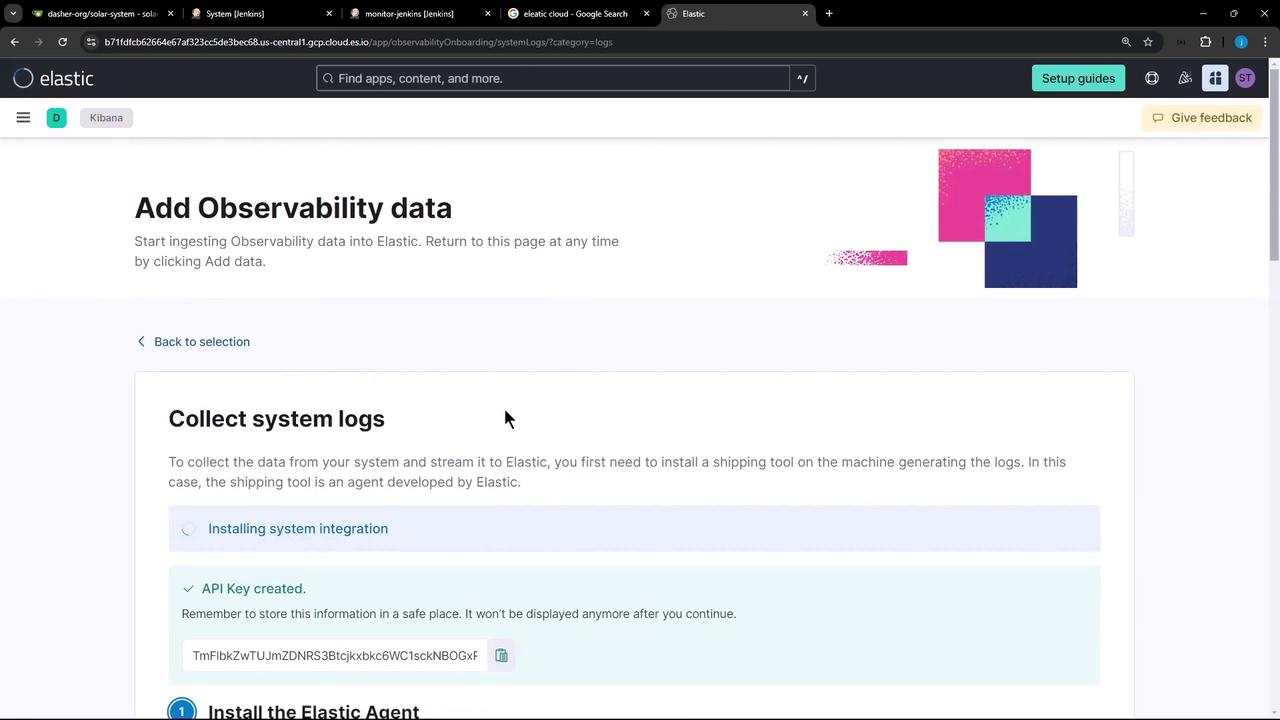
Make sure you have sufficient permissions to generate API keys. If you lose the key, regenerate it in the Elastic Cloud console.
2. Download and Install the Elastic Agent
SSH into your Jenkins controller (Linux) and run the standalone install script. Replace the placeholders with your actual API key and endpoint URL.3. Configure the Elastic Agent to Stream Jenkins Audit Logs
Open the main agent config file and add your Jenkins audit log path underinputs:
Editing
elastic-agent.yml with incorrect indentation or syntax will prevent the agent from starting. Always back up the original file before making changes.4. Verify Logs in Kibana
Return to Observability » Logs in Kibana. Within seconds, your Jenkins audit entries should appear in the stream. If you don’t see any data, open the Troubleshooting panel for diagnostics.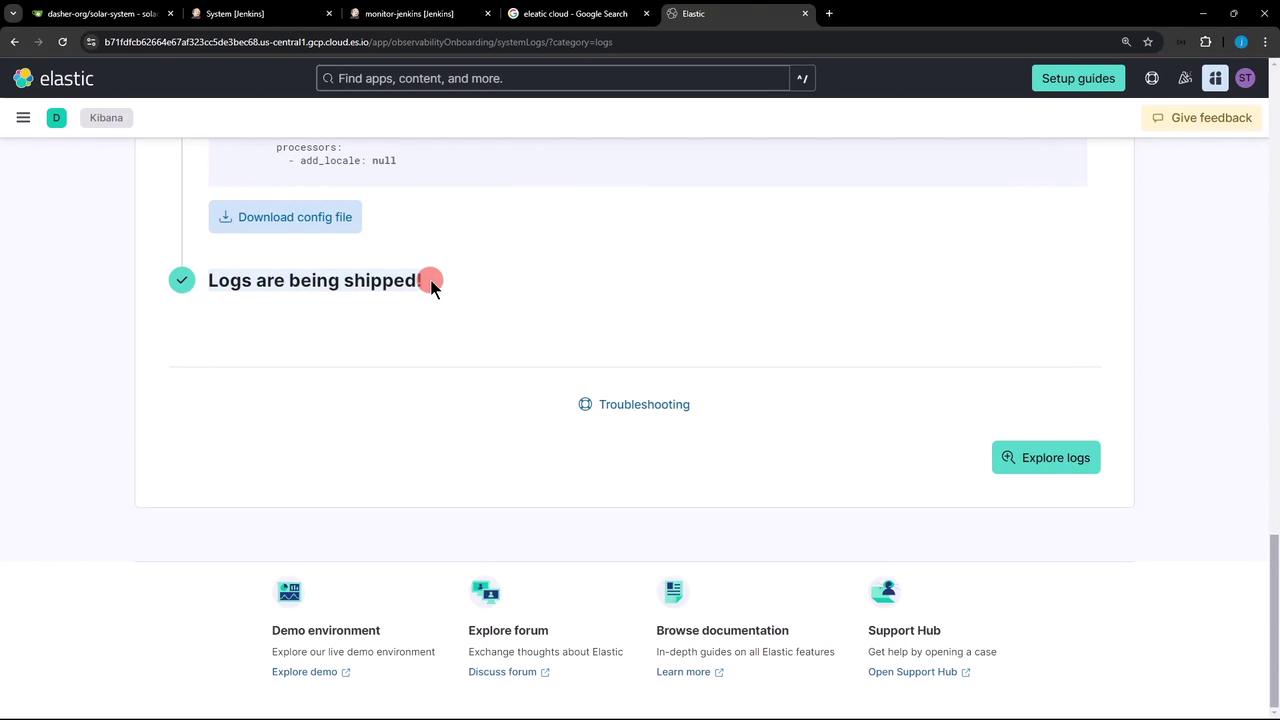
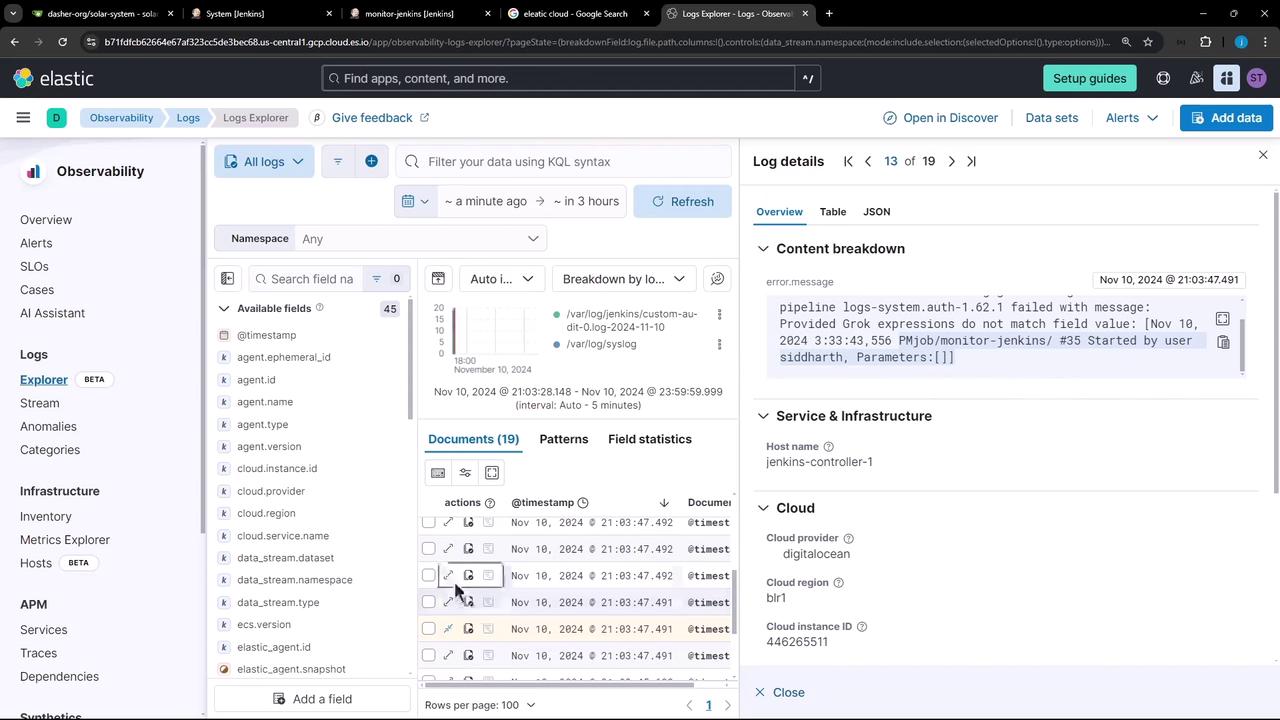
5. Explore Jenkins Audit Logs
In Logs Explorer, filter by thejenkins-audit tag or system.auth dataset. Click on individual events to inspect metadata such as user, timestamp, and action.
Configuration Summary
| Section | Purpose | Example |
|---|---|---|
| outputs | Elasticsearch endpoint & API key | hosts: […]; apikey: ‘NaemPMfB…‘ |
| inputs | Defines log file path and parsing rules | paths: /var/log/jenkins/custom-audit-*.log |