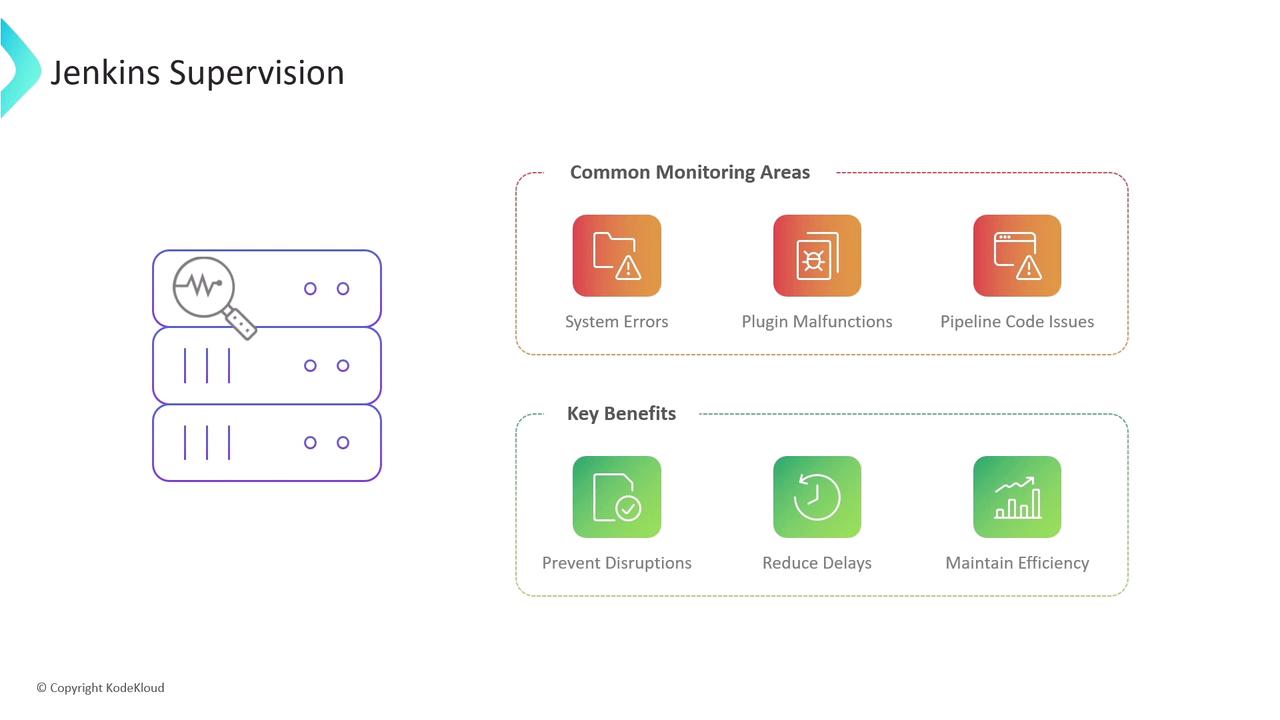
- Logs and their insights
- Performance and resource monitoring
- Auditing user activity and configuration changes
1. Logs: The Foundation of Jenkins Insights
Jenkins logs reveal crucial details about server operations and pipeline executions. Depending on your setup, log locations vary:Rotate and compress your logs regularly to prevent disk overload. Adjust the
maxFileSize and maxBackupIndex settings in your logging configuration.2. Performance and Resource Monitoring
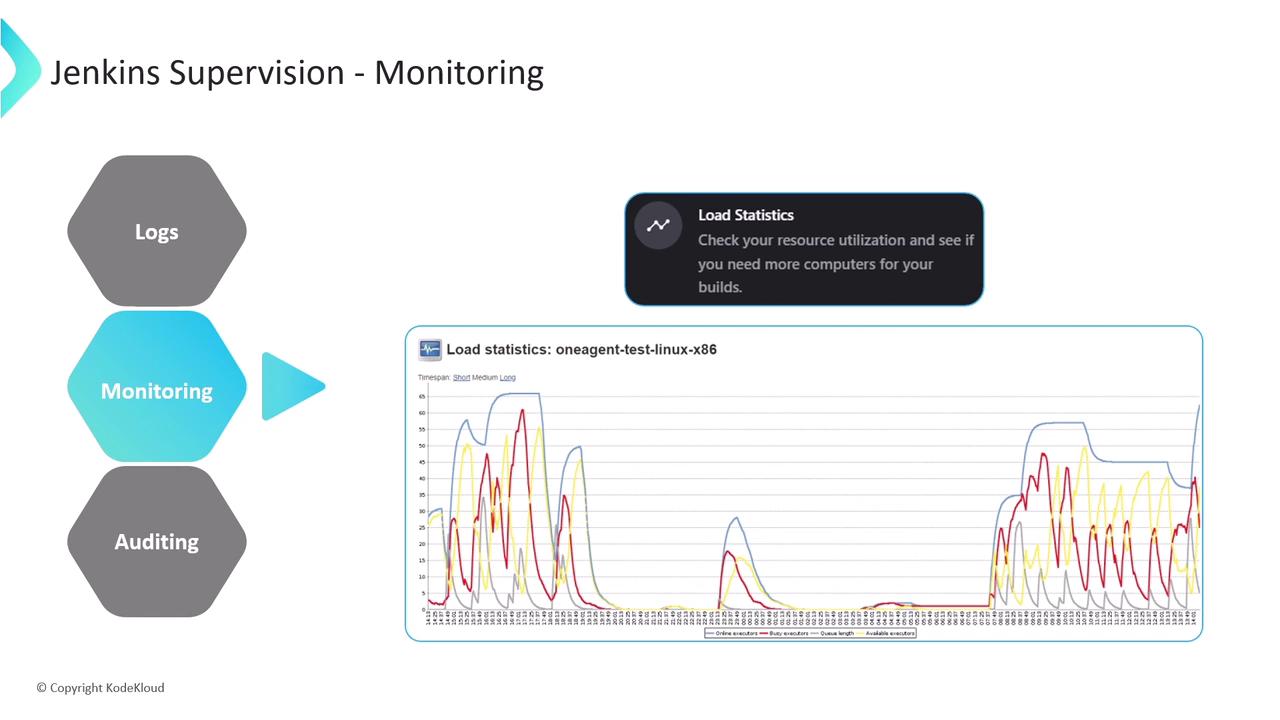
Jenkins offers built-in dashboards to track server health:- Available executors: Idle workers ready for builds
- Busy executors: Currently running jobs
- Pending jobs: Queued builds
- Overall server load: Aggregate workload metric
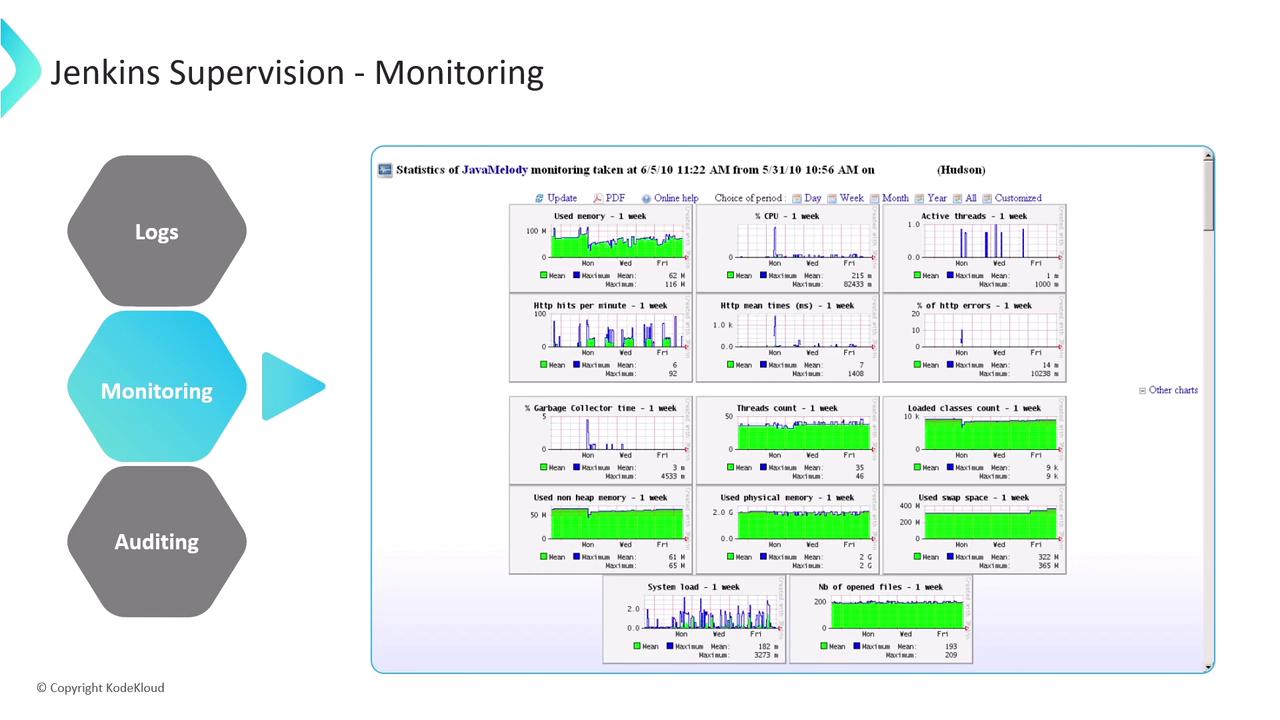
Key Plugins for Jenkins Monitoring
| Plugin | Purpose | Major Features |
|---|---|---|
| Monitoring Plugin | JVM & system metrics | CPU, memory, load, response times, HTTP sessions, GC details |
| Disk Usage Plugin | Disk space analysis | Job/workspace usage breakdown, historical trends |
| Build Monitor Plugin | Visual job status | Customizable job view, failure highlights |
Integrating with External Systems
For centralized dashboards, use: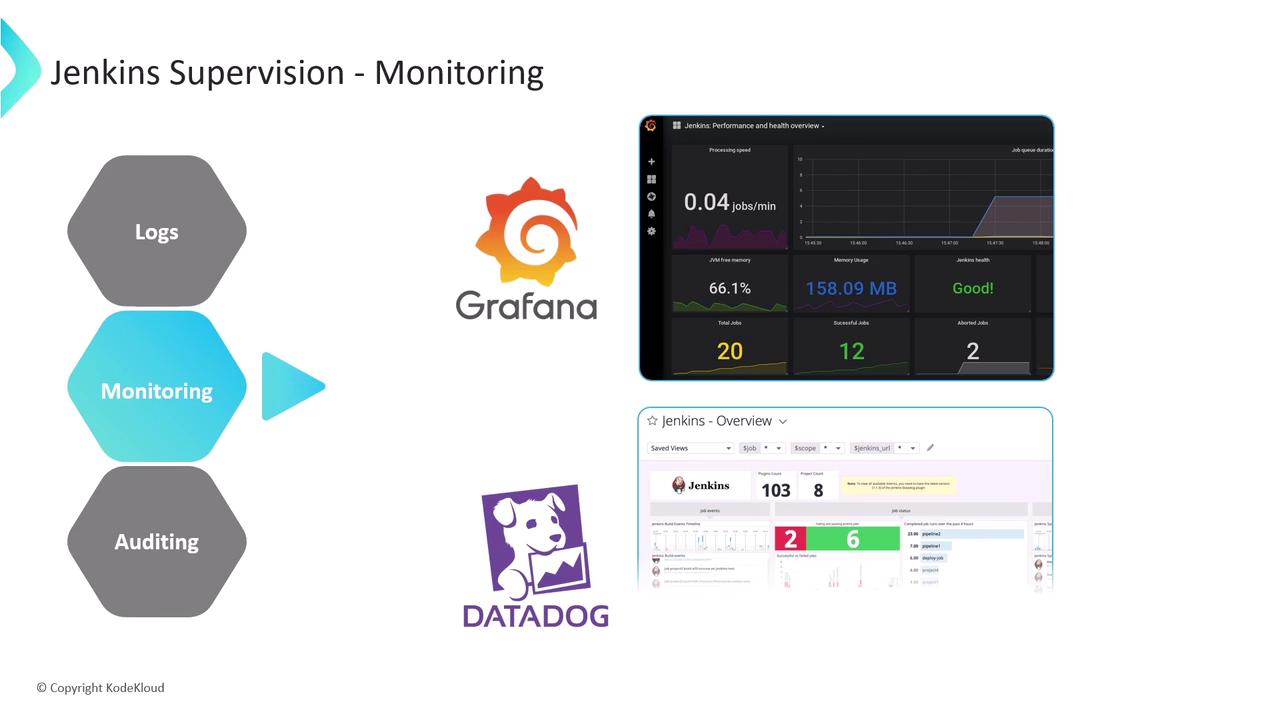
3. Auditing and Configuration Changes
Tracking who did what—and when—is vital for compliance and troubleshooting. Two complementary plugins capture user actions and config updates:| Plugin | Function | Highlights |
|---|---|---|
| Audit Trail Plugin | User action logging | File, Syslog, Elasticsearch, or Console logger options |
| Job Config History Plugin | Version control for configs | Records config.xml changes, diff view, and rollback capability |
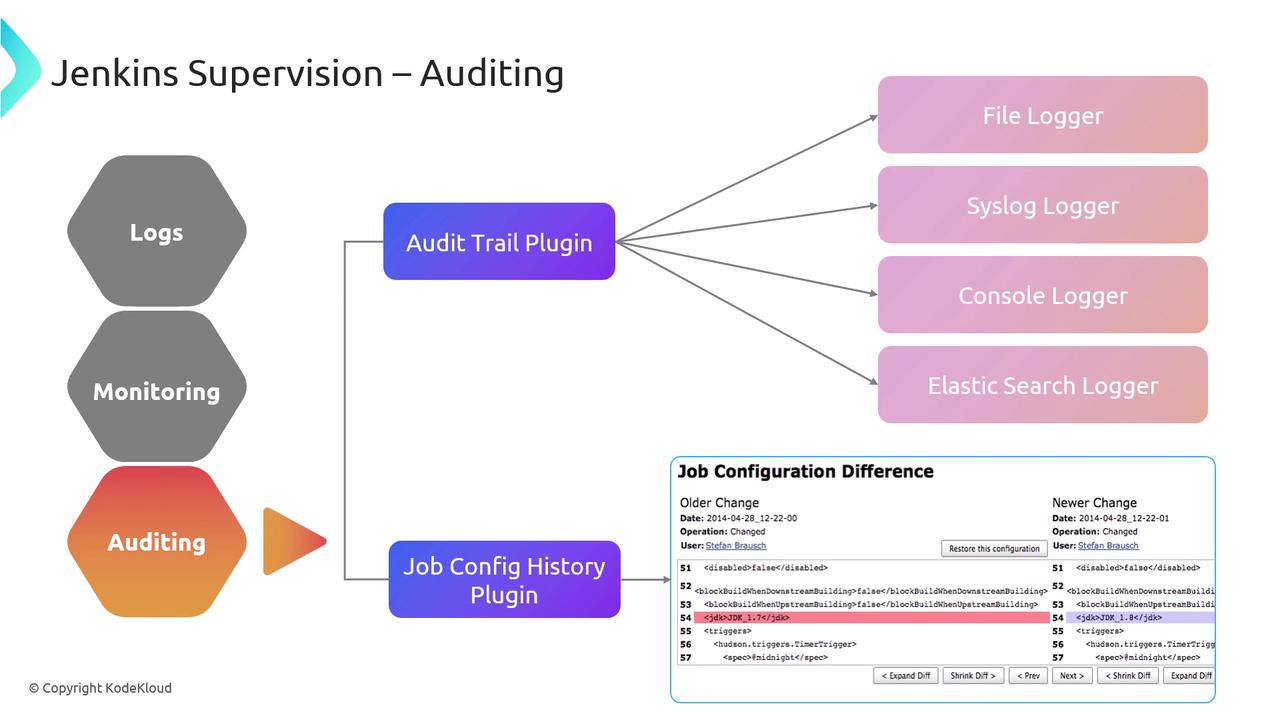
- File Logger (default, rotating files)
- Syslog Logger (central syslog server)
- Console Logger (for quick debugging)
- Elasticsearch Logger (powerful search & analytics)
Avoid using the Console Logger in production—it can expose sensitive data in build logs.