Monitoring Kubernetes Cluster using in Elastic Agent
This guide explains how to monitor a Kubernetes cluster using Elastic Agent, including configuration, deployment, and visualization of metrics in Elastic Cloud.
Welcome to this comprehensive guide on monitoring your Kubernetes cluster with Elastic Agent. In this tutorial, you will learn how to configure Elastic Agent on your Kubernetes cluster, forward logs and metrics to Elastic Cloud, and visualize your data on a pre-configured dashboard.
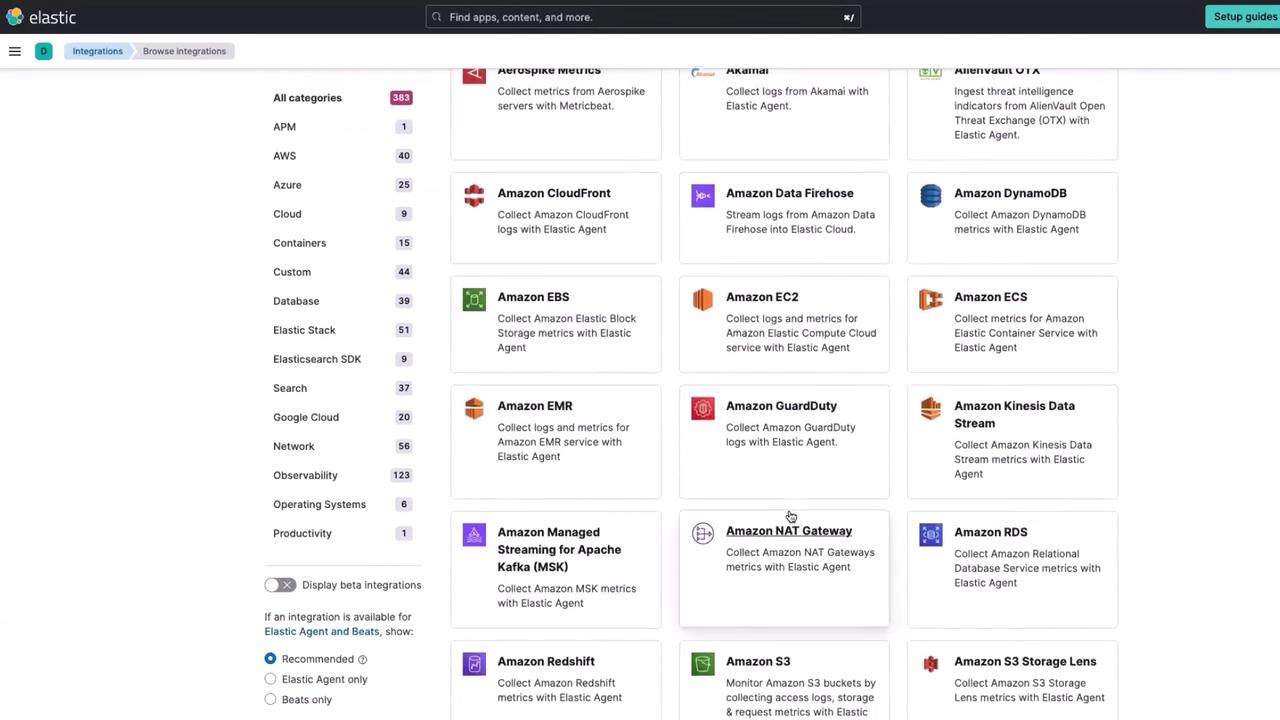
After logging into your Elastic Cloud console, click on the Add integration option. You will be presented with a list of available integrations:
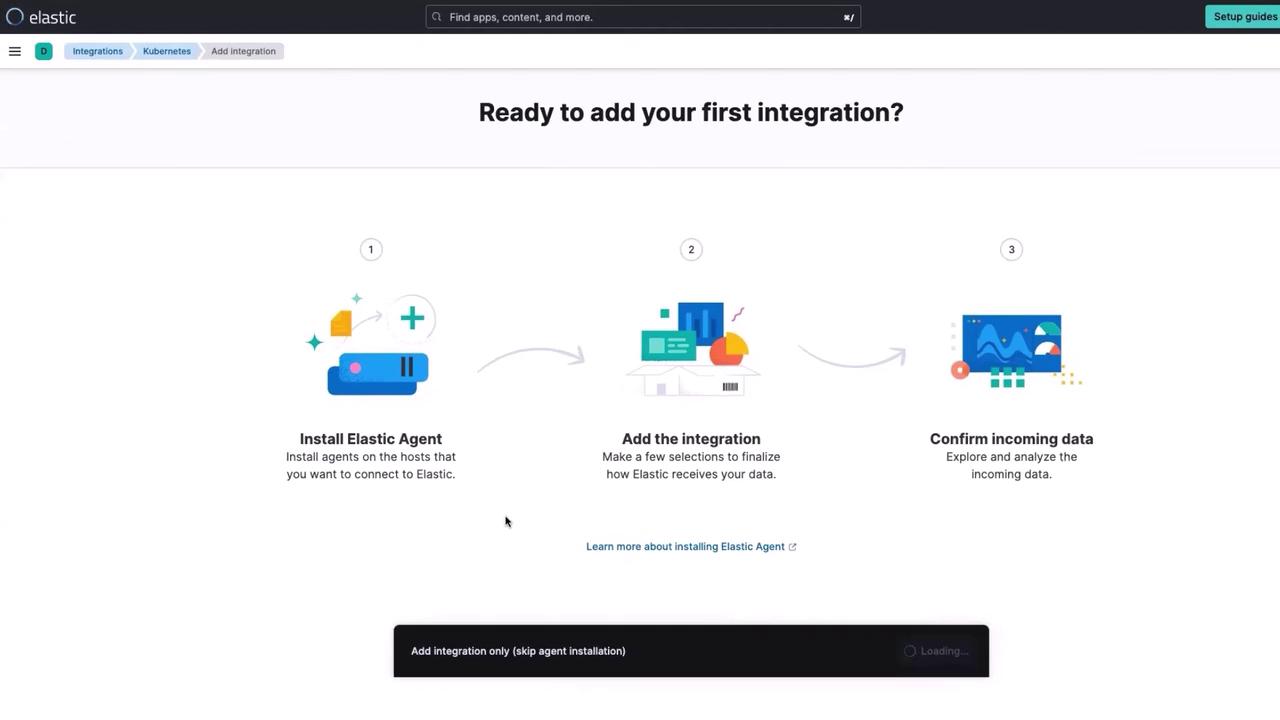
From the list, choose the Kubernetes integration and then click on Add Kubernetes. The console provides you with an installation script that will deploy the Elastic Agent on your Kubernetes cluster.
Click the Install Elastic Agent option to view the Kubernetes deployment YAML along with the command required for deployment. The top portion of the deployment file appears as follows:
Copy
Ask AI
---# For more information see: https://www.elastic.co/guide/en/fleet/current/running-on-kubernetes-managed-by-fleet.htmlapiVersion: apps/v1kind: DaemonSetmetadata: name: elastic-agent namespace: kube-system labels: app: elastic-agentspec: selector: matchLabels: app: elastic-agent template: metadata:
Next, copy the complete YAML content from the page into a new file (e.g., elastic-agent-managed-kubernetes.yml). Ensure that your YAML file includes the necessary specifications for proper scheduling, such as tolerations for control-plane nodes, to ensure that metrics from Kubernetes control components (scheduler, controller manager) are collected:
Copy
Ask AI
spec:
  selector:
    matchLabels:
      app: elastic-agent
  template:
    metadata:
      labels:
        app: elastic-agent
  spec:
    # Tolerations are needed to run Elastic Agent on Kubernetes control-plane nodes.
    # Agents running on control-plane nodes collect metrics from the control plane
    # components (scheduler, controller manager) of Kubernetes.
    tolerations:
      - key: node-role.kubernetes.io/control-plane
        effect: NoSchedule
      - key: node-role.kubernetes.io/master
        effect: NoSchedule
    serviceAccountName: elastic-agent
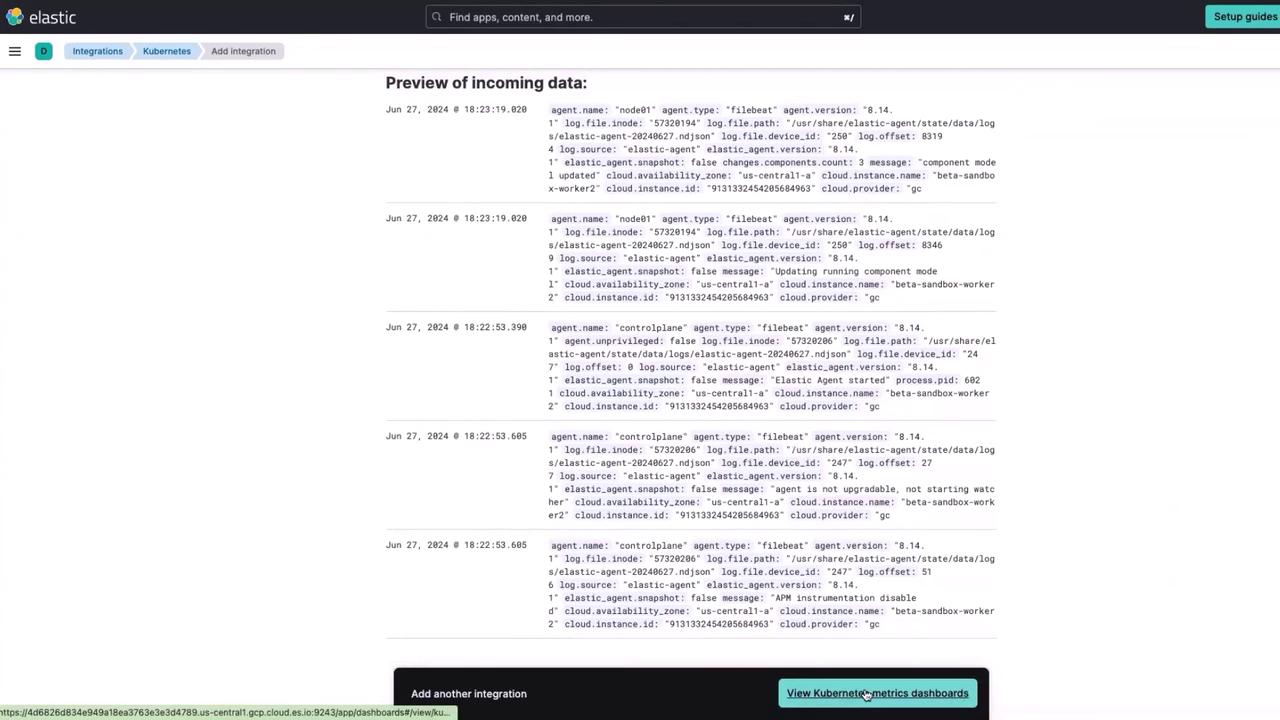
After a short wait, the Elastic Agent pods will transition to the running state. Re-run the command above to ensure that both agents are active. You should also see console output similar to the following when the daemonset deployment is applied:
Copy
Ask AI
daemonset.apps/elastic-agent createdclusterrolebinding.rbac.authorization.k8s.io/elastic-agent createdrolebinding.rbac.authorization.k8s.io/elastic-agent createdclusterrole.rbac.authorization.k8s.io/elastic-agent createdrole.rbac.authorization.k8s.io/elastic-agent createdserviceaccount/elastic-agent created
Once the Elastic Agent is enrolled, Elastic Cloud automatically starts collecting metrics from your Kubernetes cluster. In your Elastic Cloud console:
Click on Confirm data.
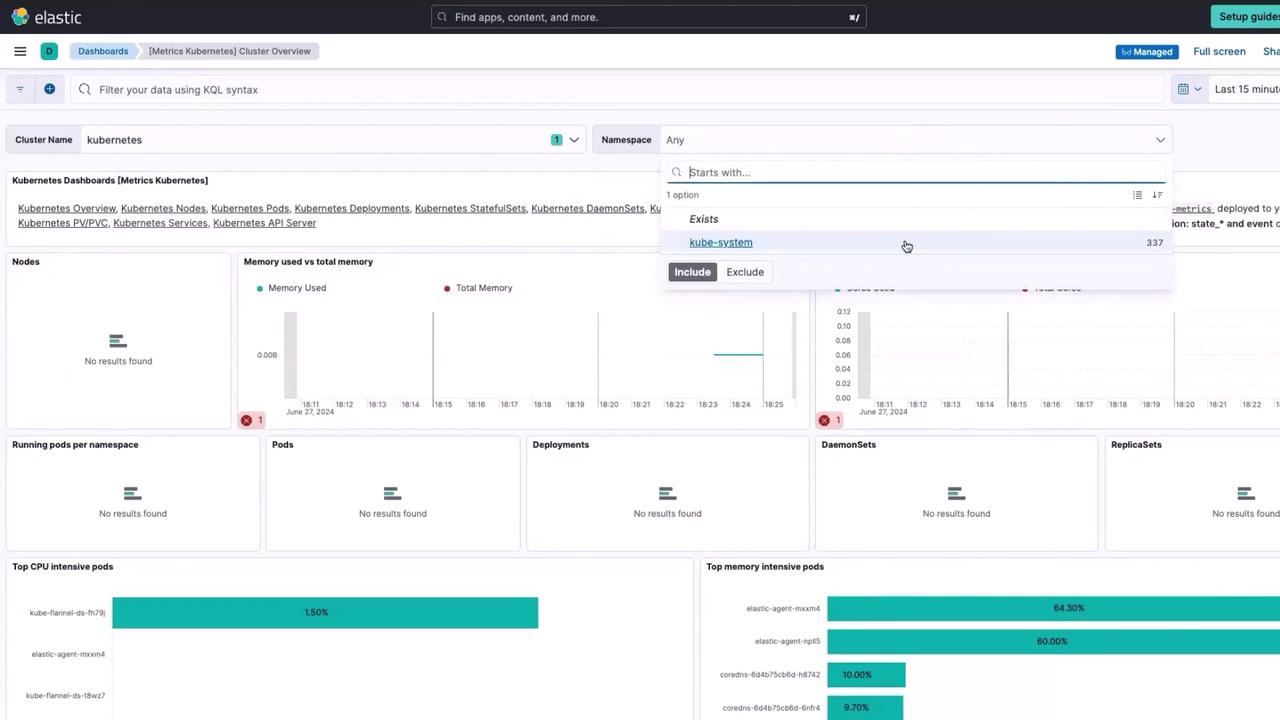
Select View Kubernetes metrics on the dashboard.
Within a few minutes, you will see metrics such as node details, memory usage, CPU core counts, and even information about the top memory-intensive pods appear on the dashboard. For instance, the default dashboard displays the Elastic Agent running in the kube-system namespace:
If you require a customized view, you can clone or modify the dashboard. However, note that managed dashboards provided by Elastic Cloud are maintained by the Elastic Agent and are not immediately editable.
This guide demonstrated how to seamlessly monitor your Kubernetes cluster with Elastic Agent, leveraging the robust observability and logging capabilities of Elastic Cloud. For further reading, explore additional resources: