This article explores monitoring storage performance using tools like iostat and pidstat to diagnose and manage storage device issues.
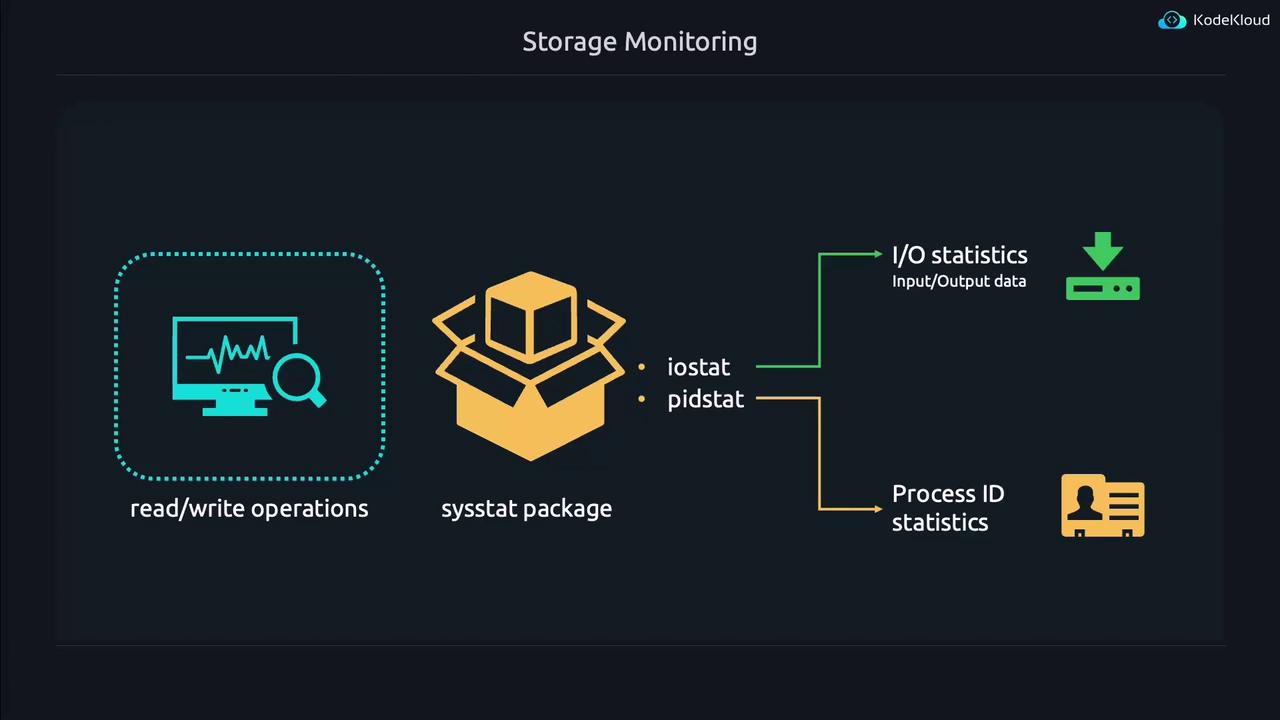
In this lesson, we explore how to monitor the performance of storage devices—similar to how we track CPU and RAM usage. Just as a CPU consistently running at 100% can slow down your system, overusing storage devices can also degrade performance. While tools such as TOP and HTOP are common for monitoring CPU and RAM usage, various utilities exist specifically for storage devices. In this guide, we will review several simple tools to help you manage and diagnose storage performance issues.There is a package called sysstat that bundles many system monitoring utilities—including iostat and pidstat, which we will focus on. Install sysstat with:
Copy
Ask AI
sudo apt install sysstat
The installation process may display output similar to this:
Copy
Ask AI
$ sudo apt install sysstatReading package lists... DoneBuilding dependency tree... DoneReading state information... DoneSuggested packages: isagThe following NEW packages will be installed: sysstat0 upgraded, 1 newly installed, 0 to remove and 330 not upgraded.update-alternatives: using /usr/bin/sar.sysstat to provide /usr/bin/sar (sar)in auto modeCreated symlink /etc/systemd/system/sysstat.service.wants/sysstat-collect.timer → /lib/systemd/system/sysstat-collect.timer
iostat, short for input/output statistics, monitors data being written to or read from a storage device. In contrast, pidstat shows statistics for process IDs (PID) interacting with the storage subsystem. Every process in Linux has a unique identifier, and pidstat helps you understand which processes create heavy I/O loads.
Below, we begin by running iostat without any arguments. This command produces a summary of storage device usage since boot:
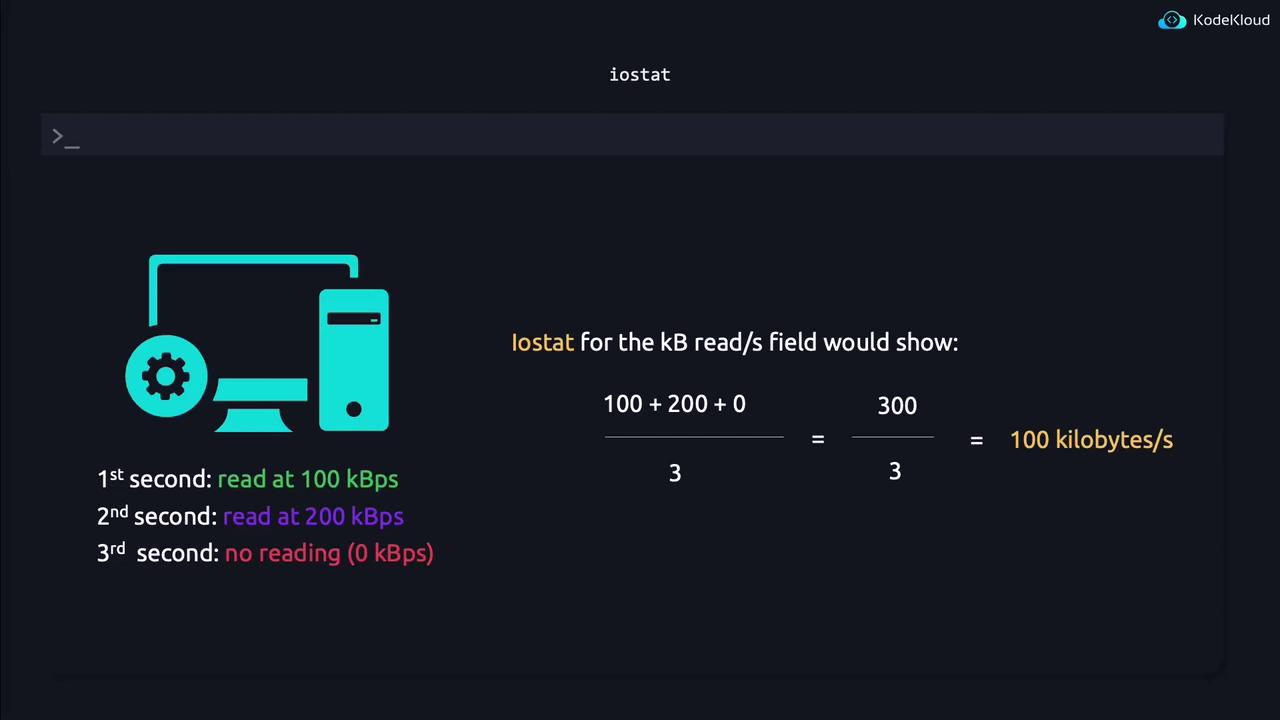
The above output represents historical usage measured since the system booted. Note that the displayed values represent averages over the system’s uptime, which might not reflect the current instantaneous load. For example, if disk reads vary over consecutive seconds, the average value shown by iostat adjusts accordingly. Fields such as TPS (transfers per second), kB_read/s, and kB_wrtn/s are computed from these running averages, while kB_read and kB_wrtn show cumulative totals.
In practical terms, a process that writes 1 kB repeatedly in rapid succession can cause high TPS values even if the individual write size is small. Conversely, operations involving large data transfers are more apparent when you review the cumulative values in kB_read and kB_wrtn.For instance, consider the following iostat output from a different kernel version:
Even a seemingly small write (such as 1 kB) may be reported as a larger block, particularly when larger transfers occur. A storage device can experience stress in two ways:
When a process initiates frequent read/write operations (producing a high TPS).
When large volumes of data are transferred during each operation (visible in the kB_read/kB_wrn fields).
For example, if a device capable of 2 GB/s is nearly saturated by one process, other processes may experience significant delays. Both iostat and pidstat are essential in identifying and diagnosing these issues.
For quick diagnostics, consider running iostat with a delay parameter (e.g., 1 second) to refresh the output and capture current activity.
To illustrate these concepts, let’s create a process that continuously writes to a storage device. We use the dd command to write zeros from /dev/zero into a file. The parameters for the command mean the following:
if=/dev/zero: Uses an infinite stream of zeros.
of=DELETEME: Specifies the output file.
bs=1: Sets the block size to 1 byte.
count=1000000: Writes 1 byte a million times.
oflag=dsync: Forces the write operation to bypass caching.
This background process allows you to continue using the terminal. To monitor which process is writing to the device, run iostat with a delay parameter:
Copy
Ask AI
iostat 1
The output refreshes every second. A sample refreshed output may look like:
You may wonder what the dm-0 device represents. DM stands for Device Mapper, which is used by the Logical Volume Manager (LVM) to manage storage volumes. To find out what dm-0 maps to, use:
Copy
Ask AI
sudo dmsetup info /dev/dm-0
Example output:
Copy
Ask AI
jeremy@kodekloud:~$ sudo dmsetup info /dev/dm-0[sudo] password for jeremy:Name: ubuntu--vg-ubuntu--lvState: ACTIVERead Ahead: 256Tables present: LIVEOpen count: 1Event number: 0Major, minor: 252, 0Number of targets: 1UUID: LVM-gAAfKzeoxfbviBTqNm3tActzQkhA7naII91DKxXBFhbSArz3azVx1ioaauFTXxCR
Next, verify the relationship between dm-0 and the physical devices with lsblk:
The dd process (PID 1411) is writing continuously to the storage device.
These writes are occurring on /dev/sda, accessed through the logical volume dm-0.
In a real-world scenario, a process such as a database (e.g., MariaDB) might be responsible, warranting further investigation into logs or even a restart using:
Copy
Ask AI
sudo systemctl restart mariadb
To view the full command of a given process, use:
Copy
Ask AI
ps -ef | grep 1411
If you decide to stop the process, execute:
Copy
Ask AI
kill 1411
Verify the process termination with:
Copy
Ask AI
ps 1411
Example output:
Copy
Ask AI
PID TTY STAT TIME COMMAND1411 pts/0 D 0:28 dd if=/dev/zero of=DELETEME bs=1 count=1000000 oflag=dsync
If the process does not terminate gracefully, you may force termination with the SIGKILL signal:
Copy
Ask AI
kill -9 1411
Using SIGKILL (kill -9) stops a process immediately without allowing it to perform any cleanup. Use this option only as a last resort.
This lesson demonstrated the techniques to monitor storage performance, diagnose device stress, and identify processes causing heavy I/O activity using tools like iostat and pidstat. By combining these tools with commands such as dd, dmsetup, and lsblk, you can efficiently troubleshoot and resolve storage-related performance issues.Now that you have learned these valuable monitoring techniques, let’s move on to our next lesson!