Establishing a steady-state baseline is crucial before running any chaos experiment. It helps you distinguish normal behavior from fault-induced anomalies.
Observability Tools and Key Metrics
| Observability Tool | Focus | Key Metrics |
|---|---|---|
| CloudWatch Container Insights | Cluster-level | CPU & memory utilization, alarms |
| CloudWatch Performance Dashboard | Service-level | Running pods, CPU utilization, memory use |
| CloudWatch RUM | End-user metrics | Largest Contentful Paint (LCP), First Input Delay (FID), UX ratings |
1. CloudWatch Container Insights
To begin, navigate to the CloudWatch Container Insights dashboard and select your EKS cluster. Here you can view overall CPU and memory utilization, cluster state summaries, and alarm statuses.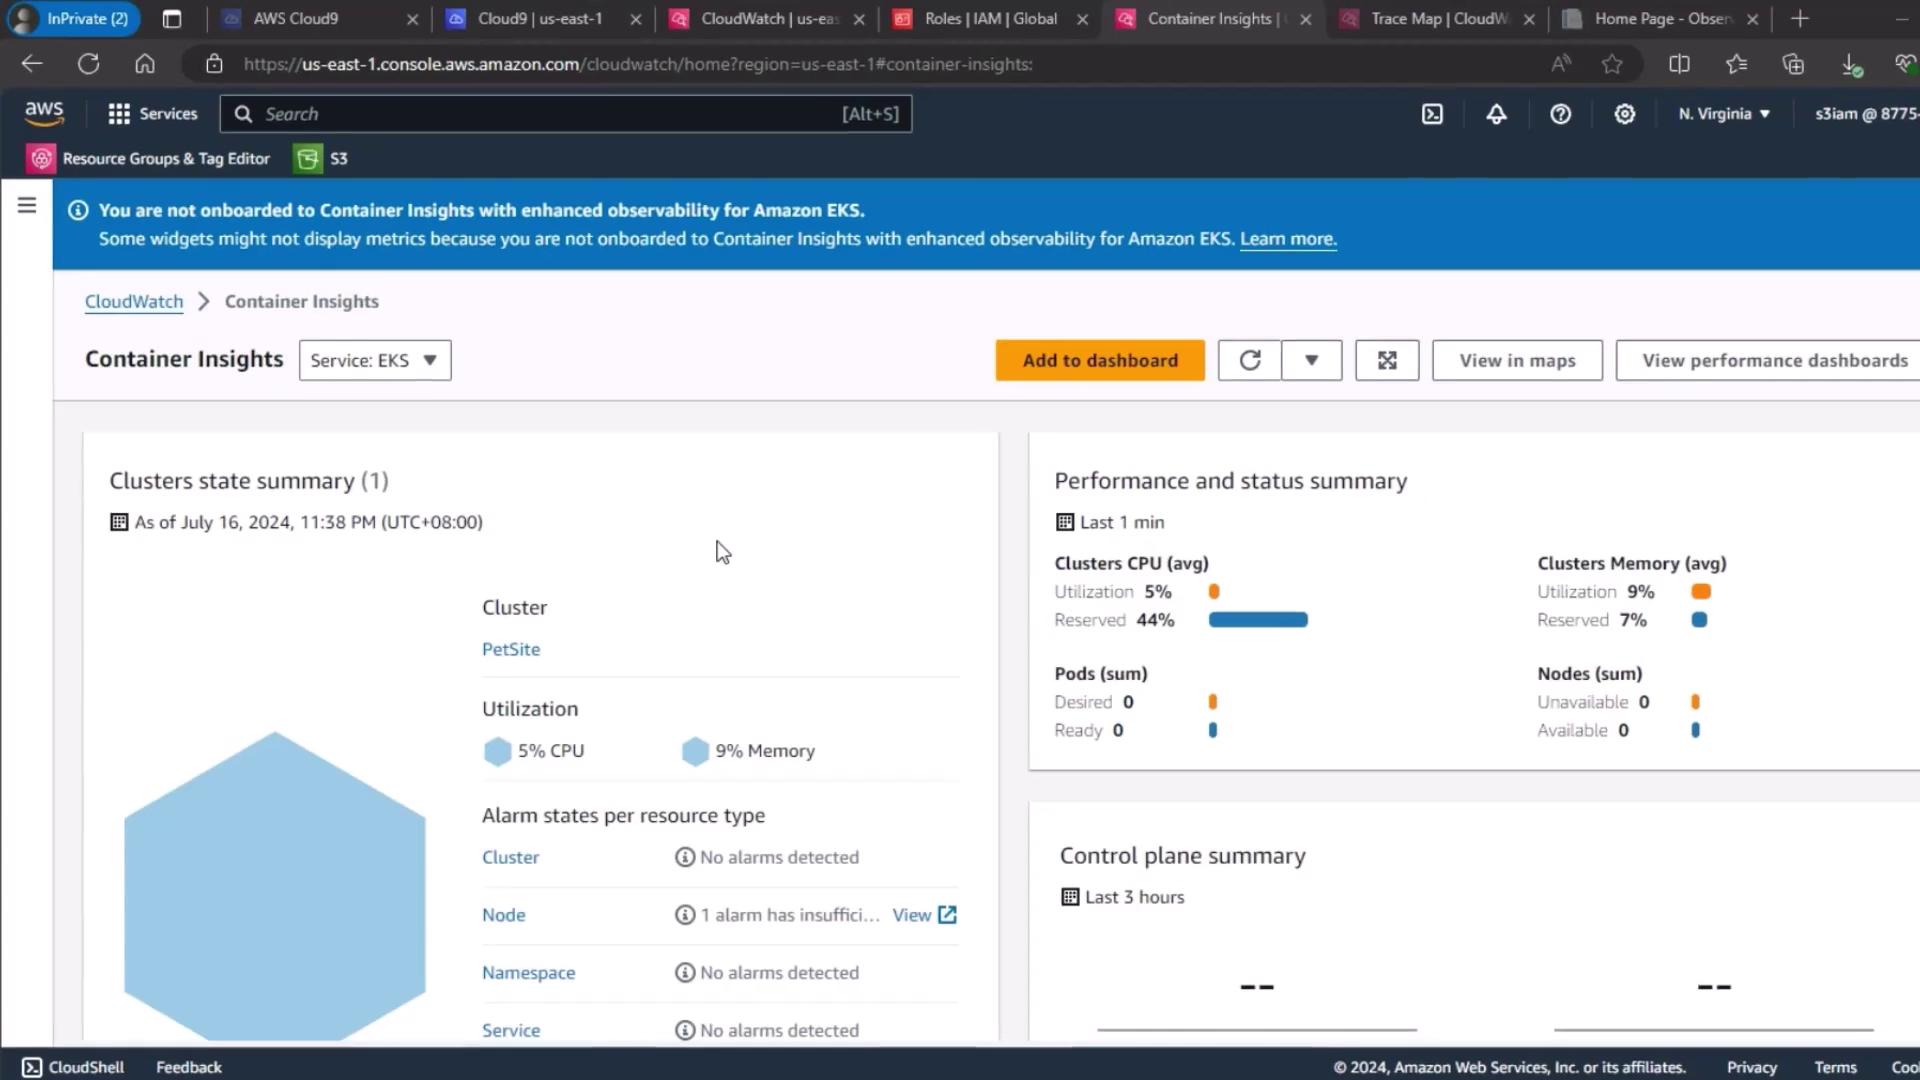
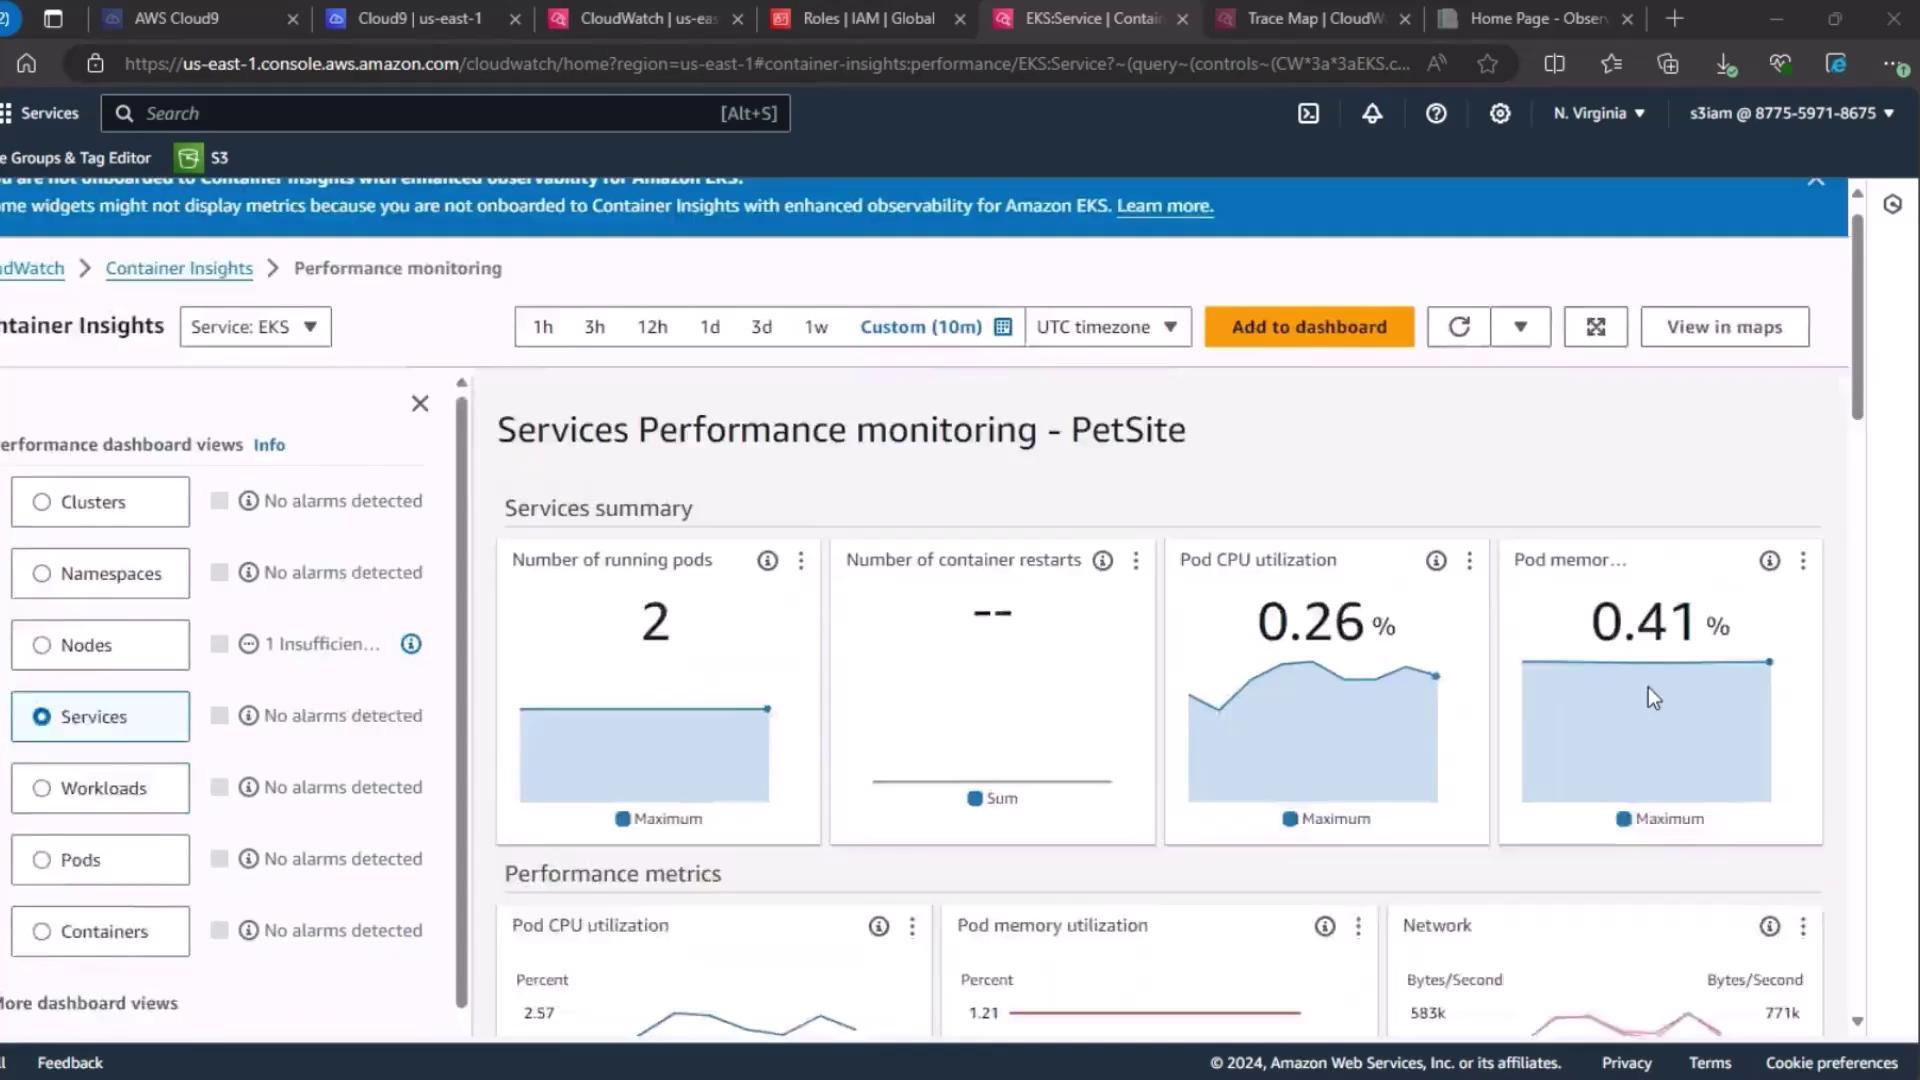
2. Service-Level Performance Dashboard
Next, go to the Services section under CloudWatch performance dashboards. Wait for the metrics to load, then review:- Number of running pods
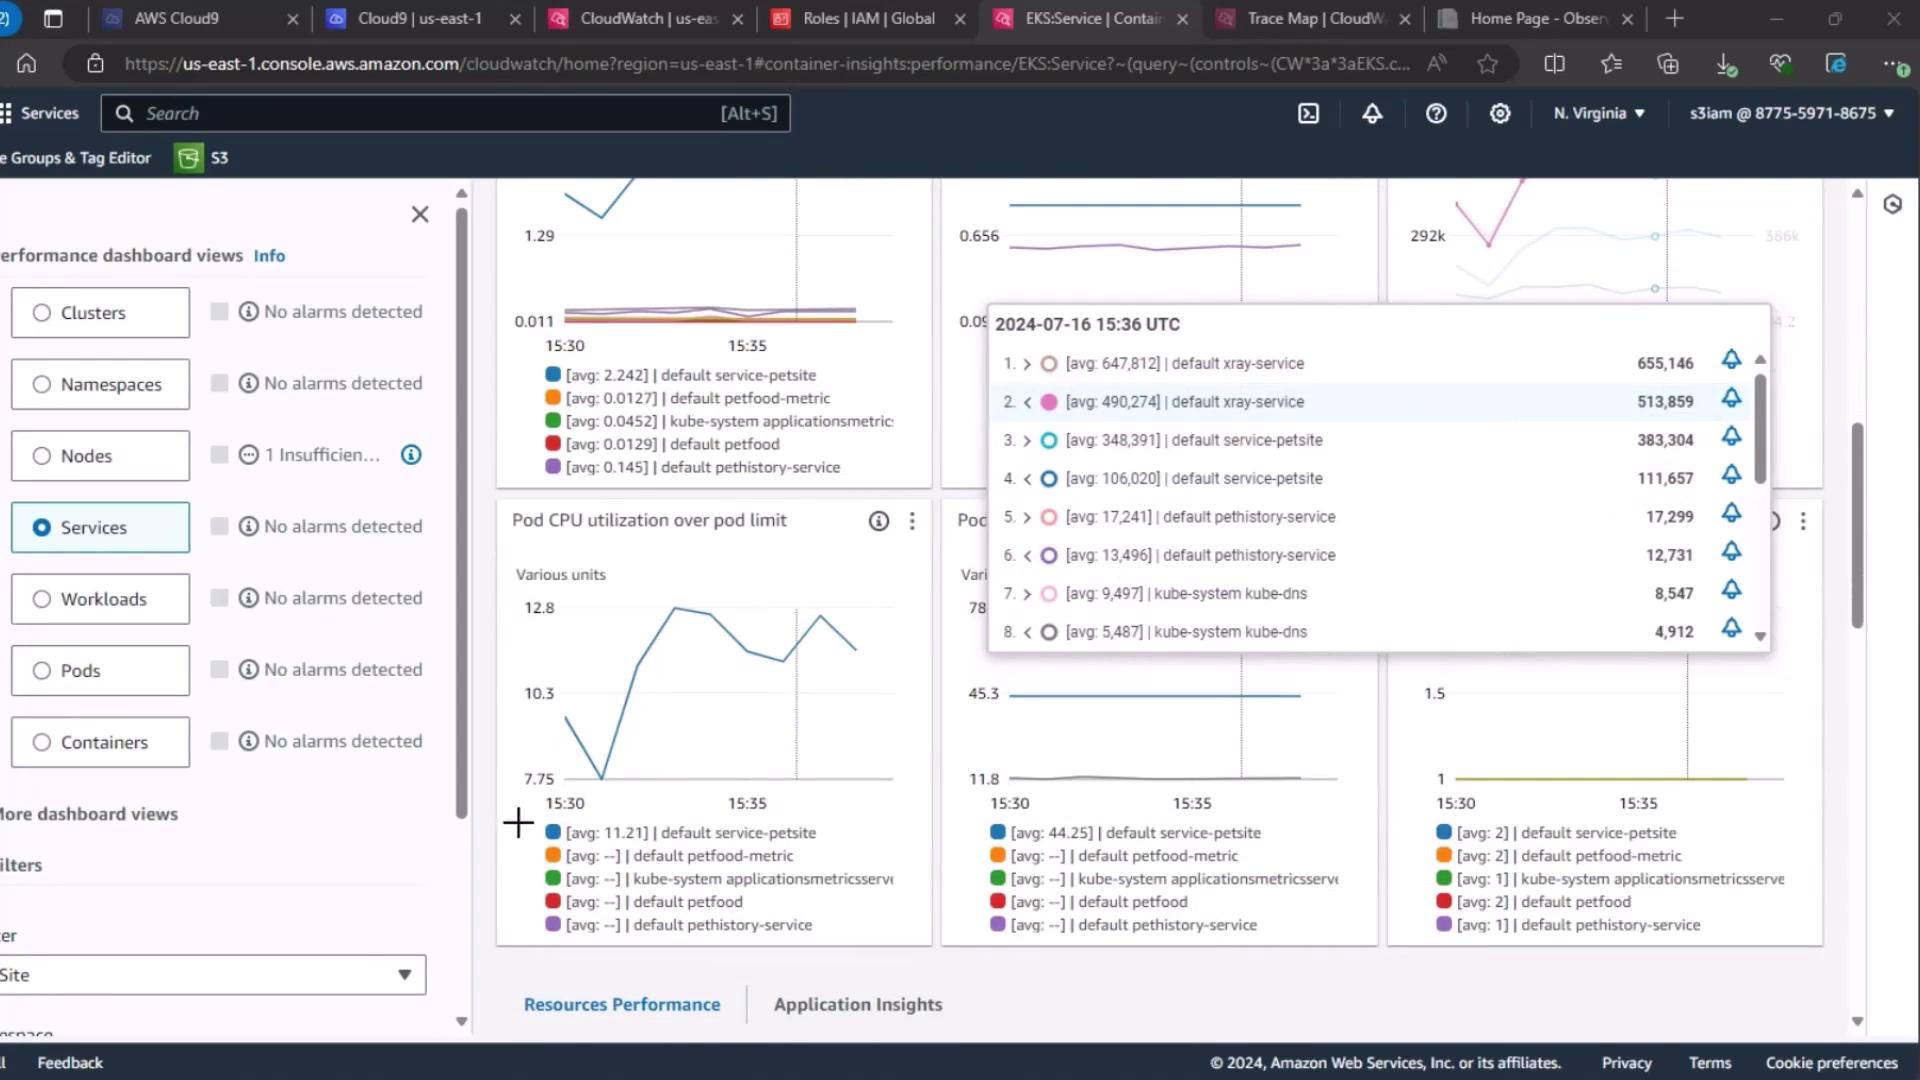
- Pod CPU utilization
- Pod memory utilization
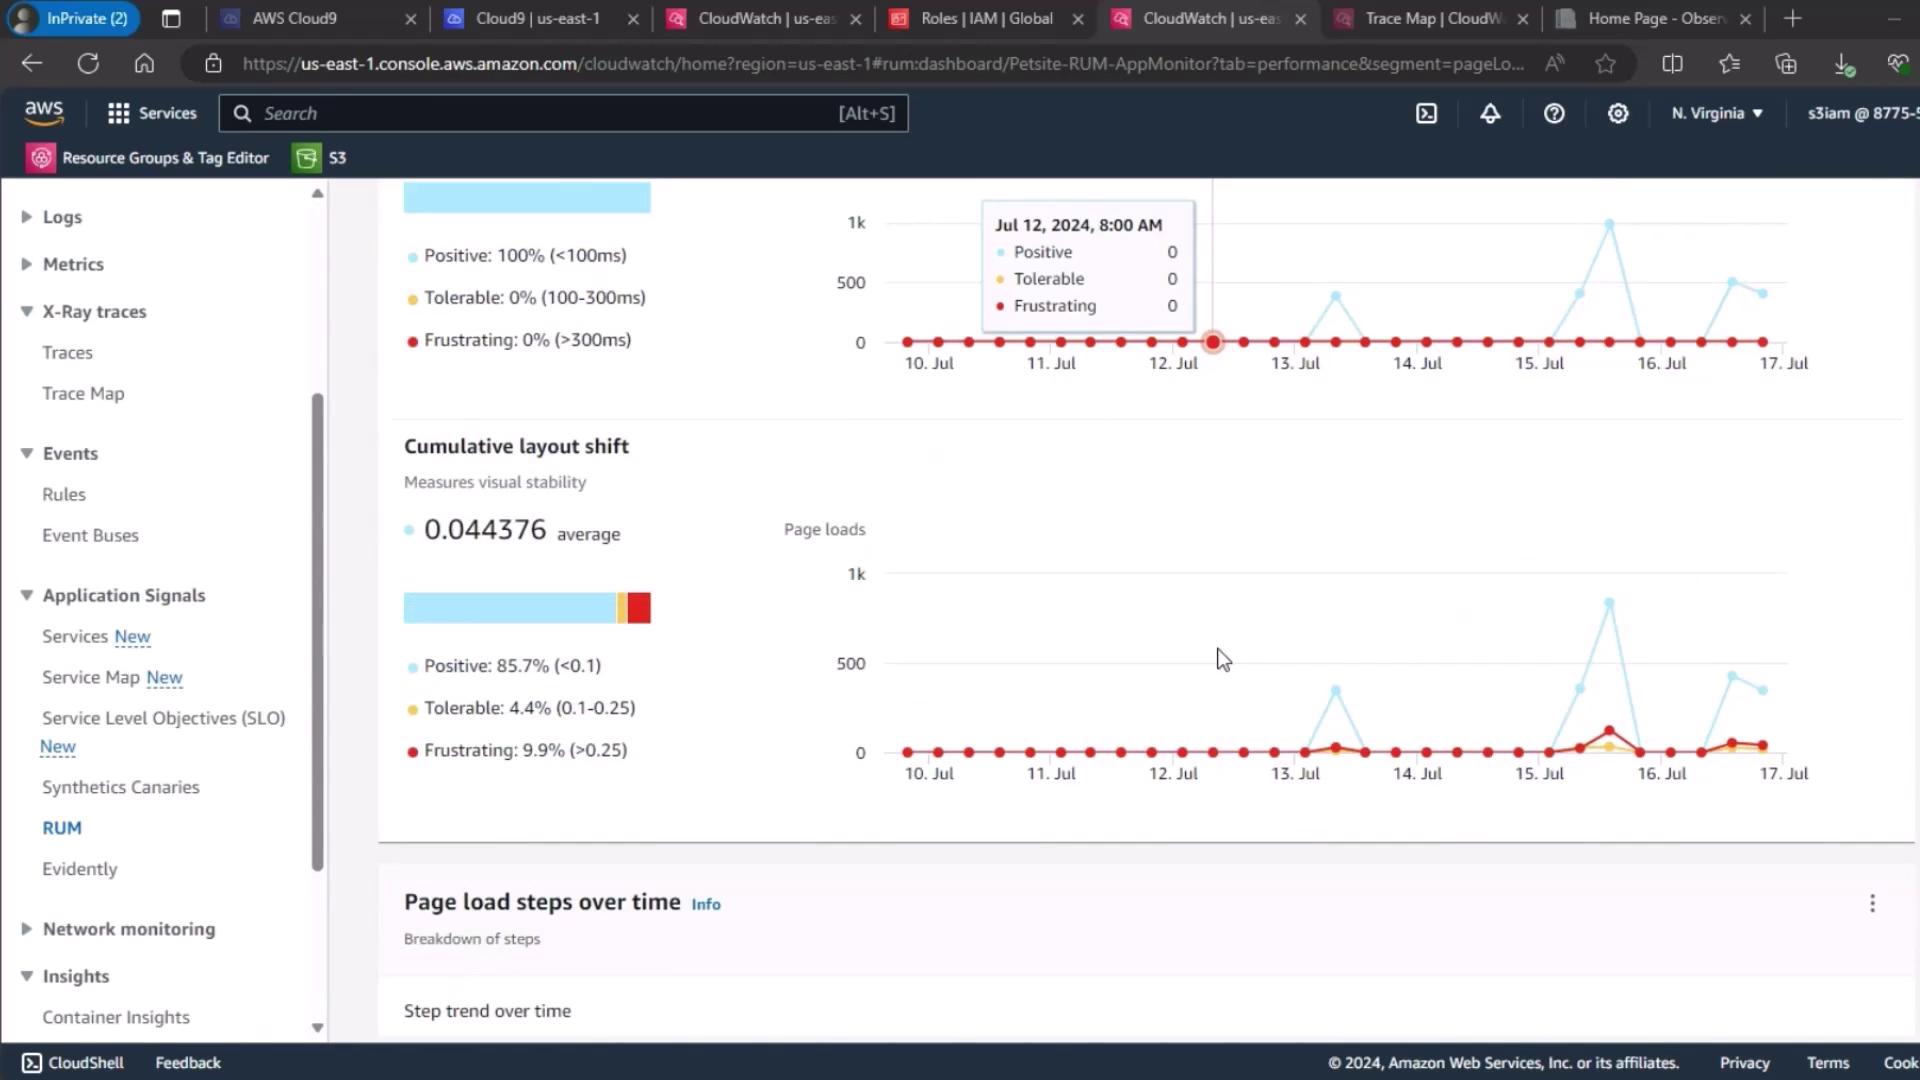
3. Real User Monitoring (RUM)
For end-user experience, use CloudWatch RUM. Select your PetSite RUM app monitor to view session quality:- Positive
- Tolerable
- Frustrating
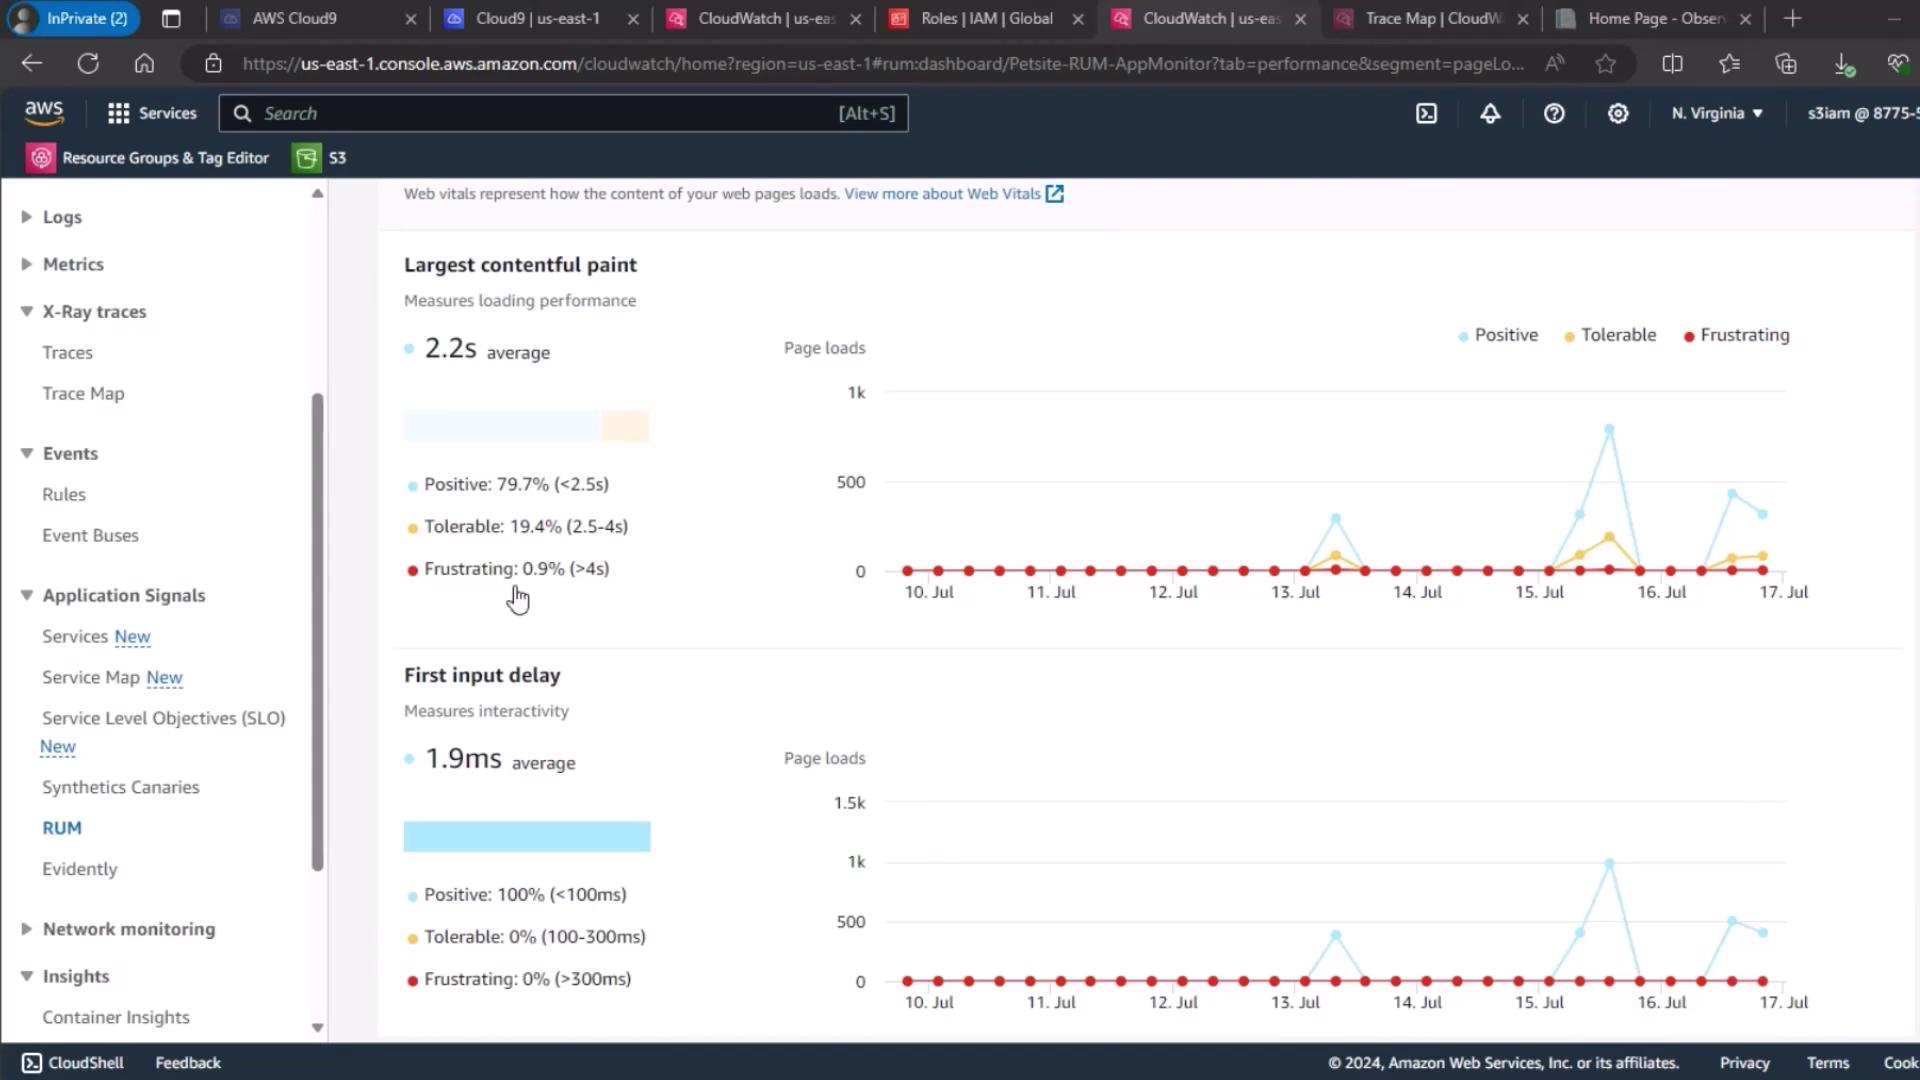
4. Page Load Metrics Overview
Finally, review the page load times and Cumulative Layout Shift (CLS) trends to understand the front-end impact before fault injection.