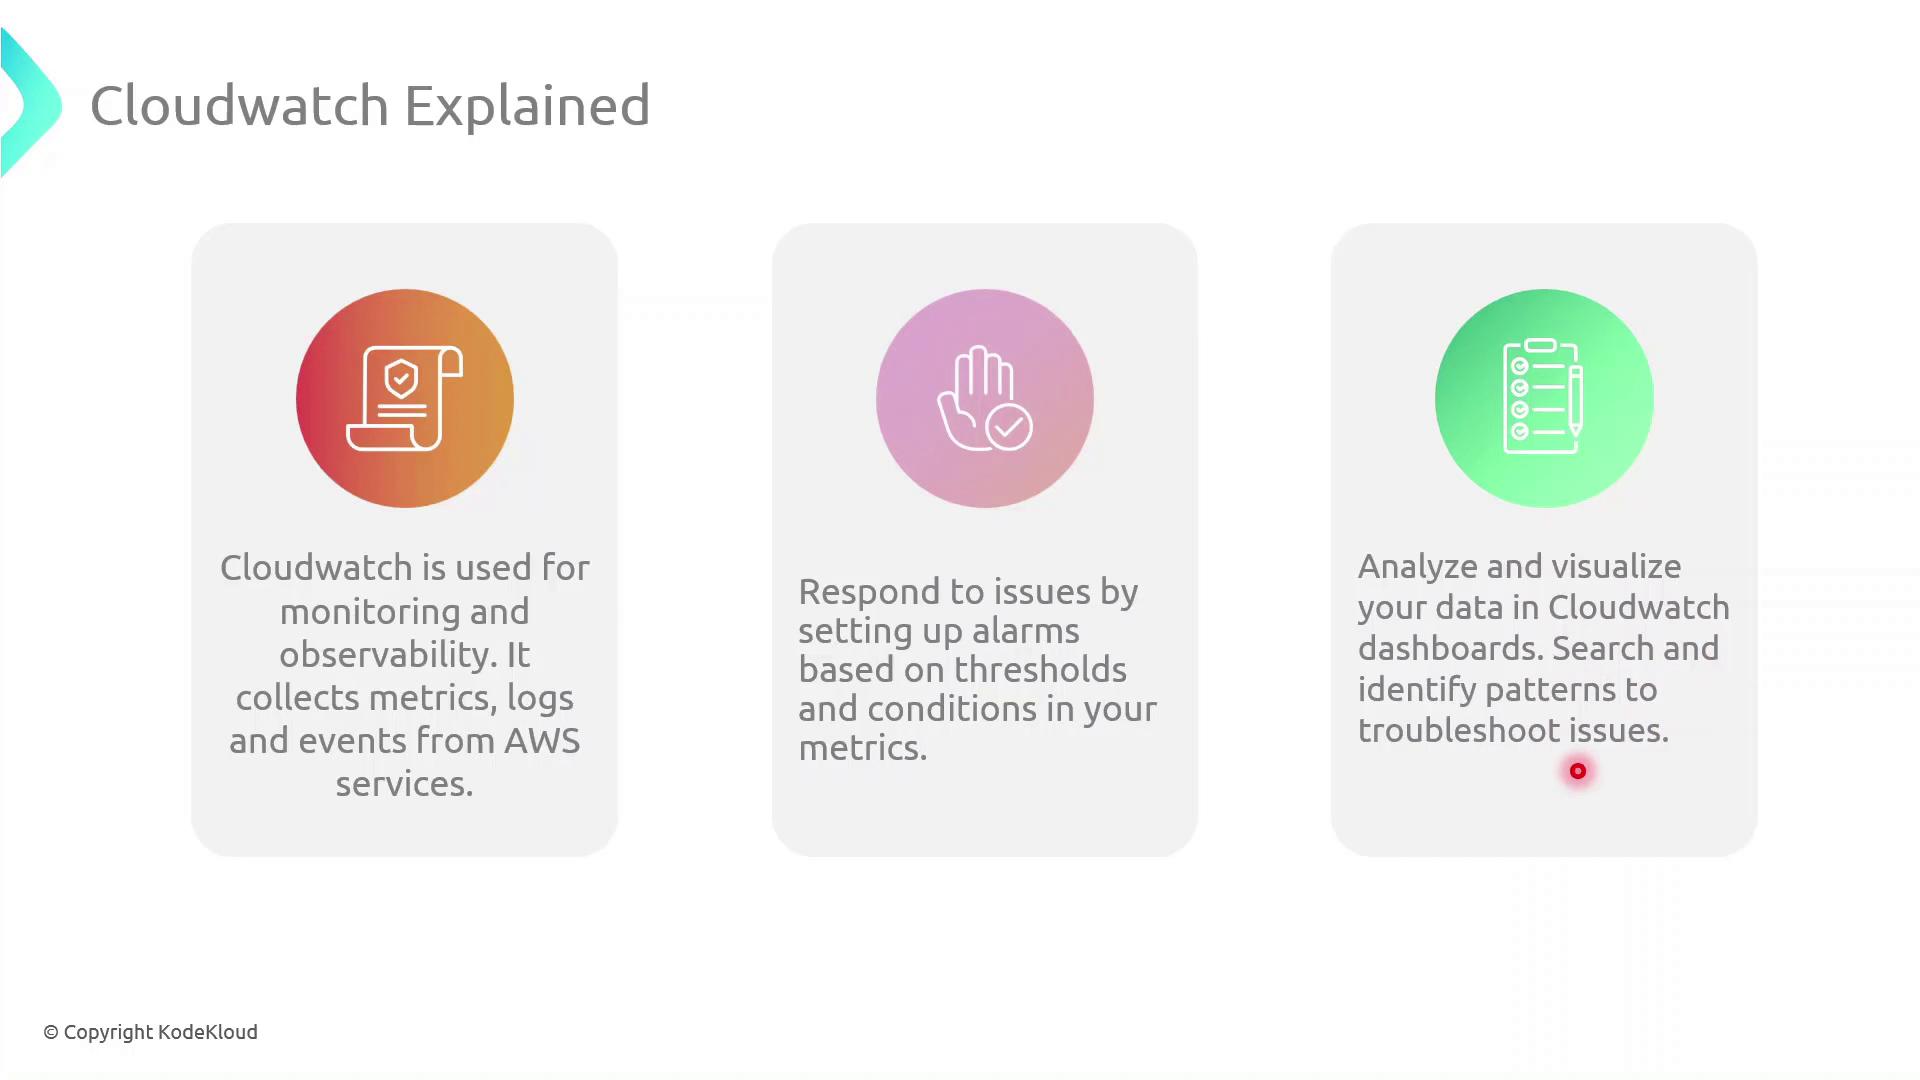
Why Use CloudWatch?
With CloudWatch, you can:- Collect and visualize metrics (CPU, memory, disk I/O, network) from AWS services and custom applications
- Aggregate, search, and analyze logs in real time
- Trigger automated actions or notifications when specified events or thresholds are met
- Build dashboards for a consolidated, at-a-glance view of your infrastructure health
Be aware that custom metrics and detailed monitoring (1-minute resolution) may incur additional charges.
Key CloudWatch Components
| Component | Purpose |
|---|---|
| Metrics | Time-series data for resource performance (e.g., CPUUtilization). |
| Logs | Centralized aggregation and querying of application and system logs. |
| Alarms | Threshold-based triggers to send notifications or invoke actions. |
| Dashboards | Customizable visualizations combining metrics and logs in one view. |
| Events/Rules | Automated reactions to state changes or scheduled tasks across AWS. |
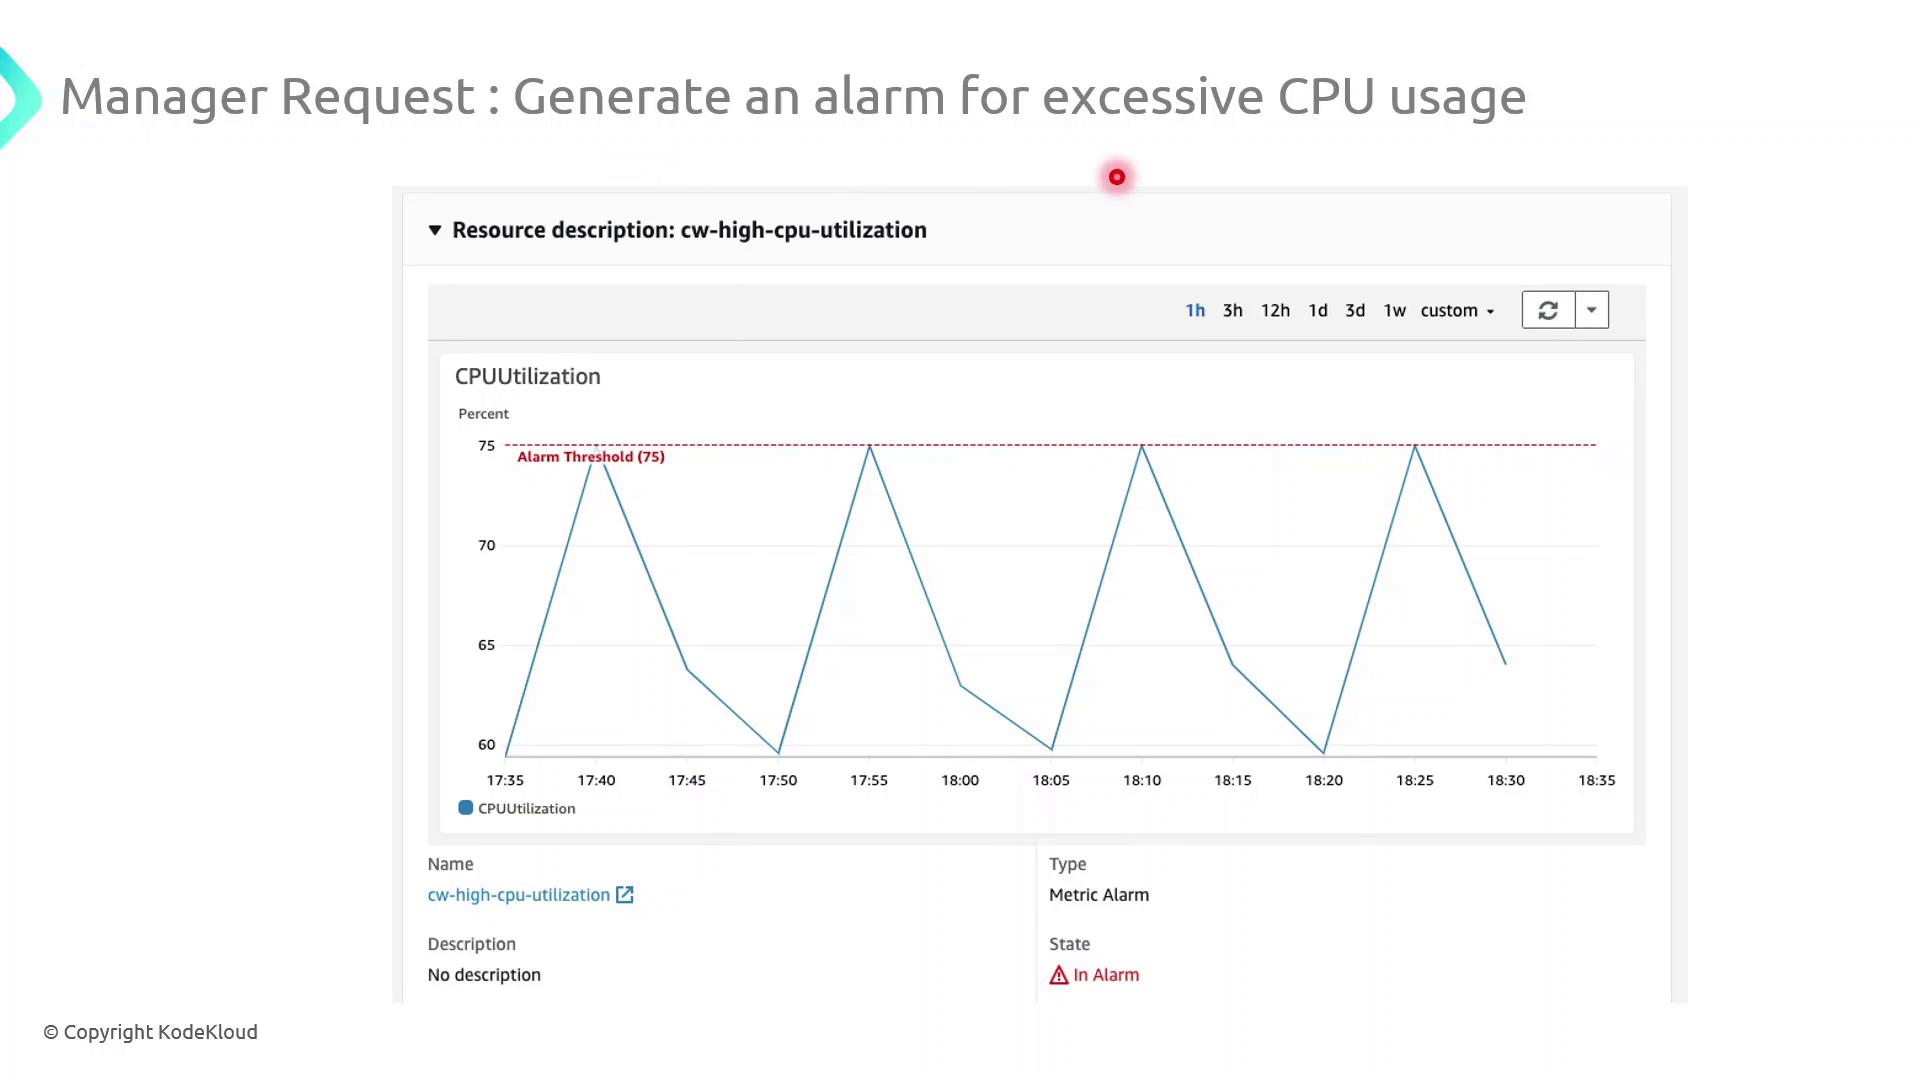
Demo: Configure a High-CPU Alarm
Follow these steps in the AWS Management Console to create an alarm that notifies you when CPU utilization exceeds 75% for 5 minutes:- Navigate to CloudWatch in the AWS Console.
- In the sidebar, choose Alarms → All alarms → Create alarm.
- Under Select metric, pick the EC2 namespace and then Per-Instance Metrics → CPUUtilization.
- Click Select metric for your target instance.
- On the Specify metric and conditions page:
- Threshold type: Static
- Whenever CPUUtilization is:
>75 - For: 5 consecutive periods of 1 minute each
- Under Configure actions, choose an SNS topic or create a new one to send email notifications.
- (Optional) Add tags to organize billing and access management.
- Review settings and click Create alarm.
Ensure your SNS subscription is confirmed; otherwise, you won’t receive alarm notifications.