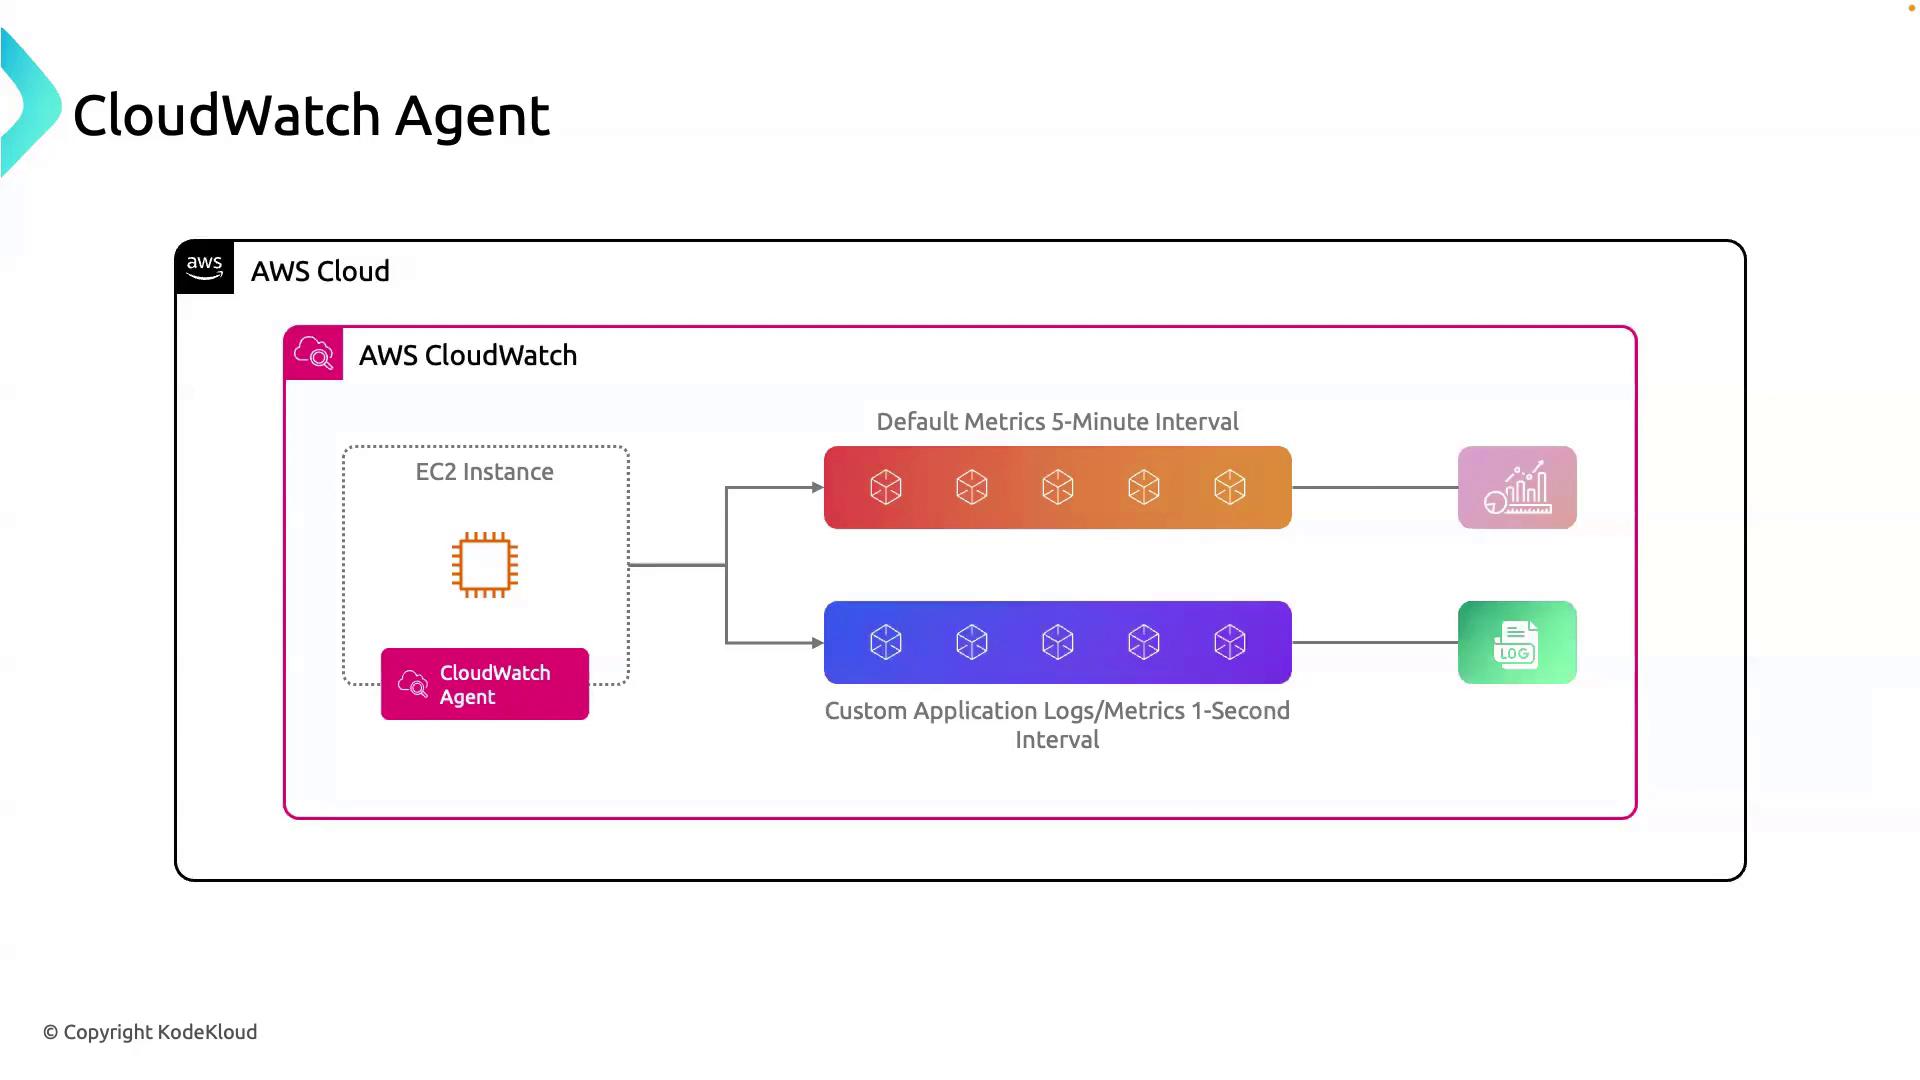
Default Metrics and Their Limitations
By default, AWS CloudWatch gathers EC2 metrics (CPU utilization, disk I/O, network traffic) at five-minute intervals. While useful for high-level monitoring, this resolution may be inadequate when you need:- Near real-time visibility into application performance
- Detailed custom metrics (e.g., request latency, queue depths)
- Centralized log streaming alongside metrics
Introducing the CloudWatch Agent
The CloudWatch Agent is a self-managed package you install on EC2 instances, servers, or virtual machines. It enables you to:- Push application-specific metrics directly to CloudWatch
- Stream log files (Apache, Nginx, system logs) in real time
- Capture metrics as frequently as one-second intervals
- Build rich dashboards, set alarms, and automate responses
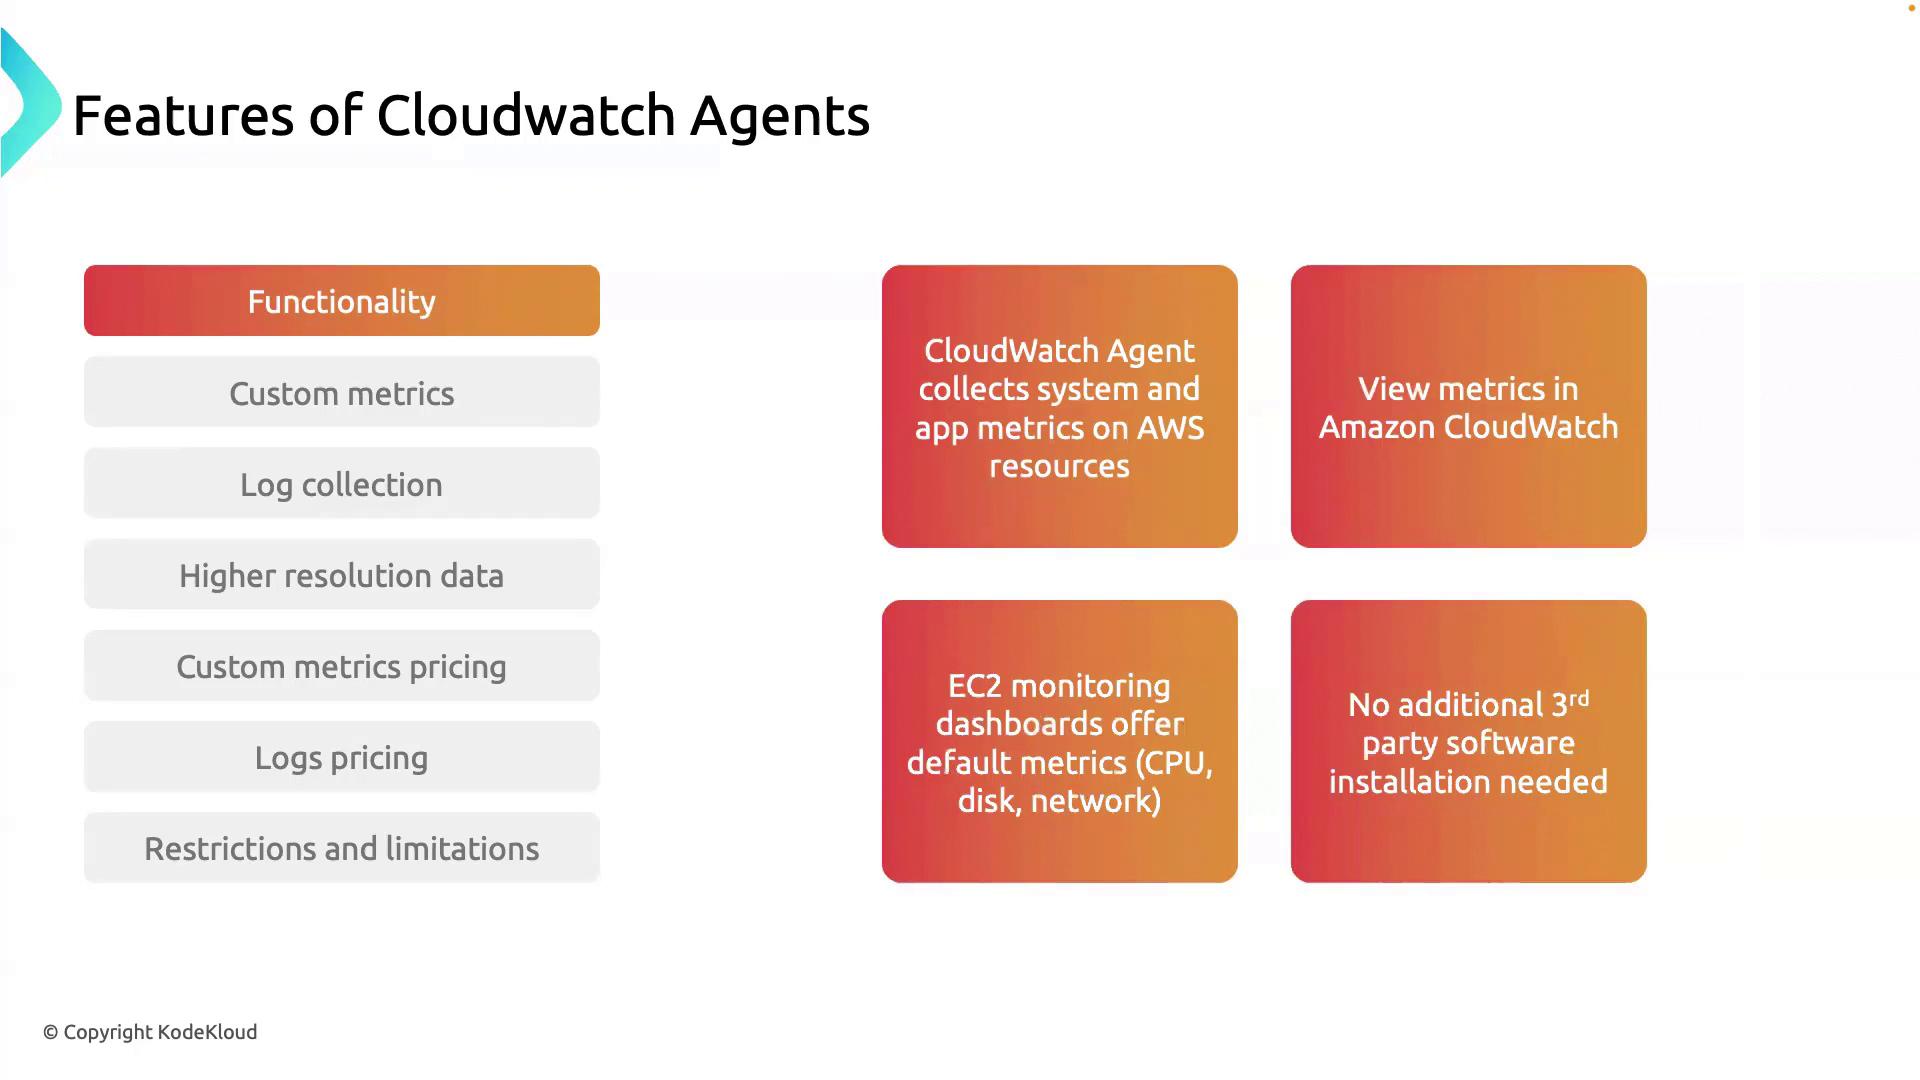
Core Functionalities
CloudWatch Agent extends built-in monitoring by:- Collecting application-level metrics (business KPIs, custom counters)
- Displaying all metrics together in CloudWatch Dashboards
- Capturing memory, disk, and other OS metrics not available by default
- Eliminating third-party monitoring agents and licensing fees
Custom Metrics
Configure the agent to emit any numeric data—request counts, error rates, business KPIs—to CloudWatch. These custom metrics appear alongside default metrics, empowering you to:- Monitor application health in real time
- Create alarms on business-critical thresholds
- Visualize trends over time in dashboards
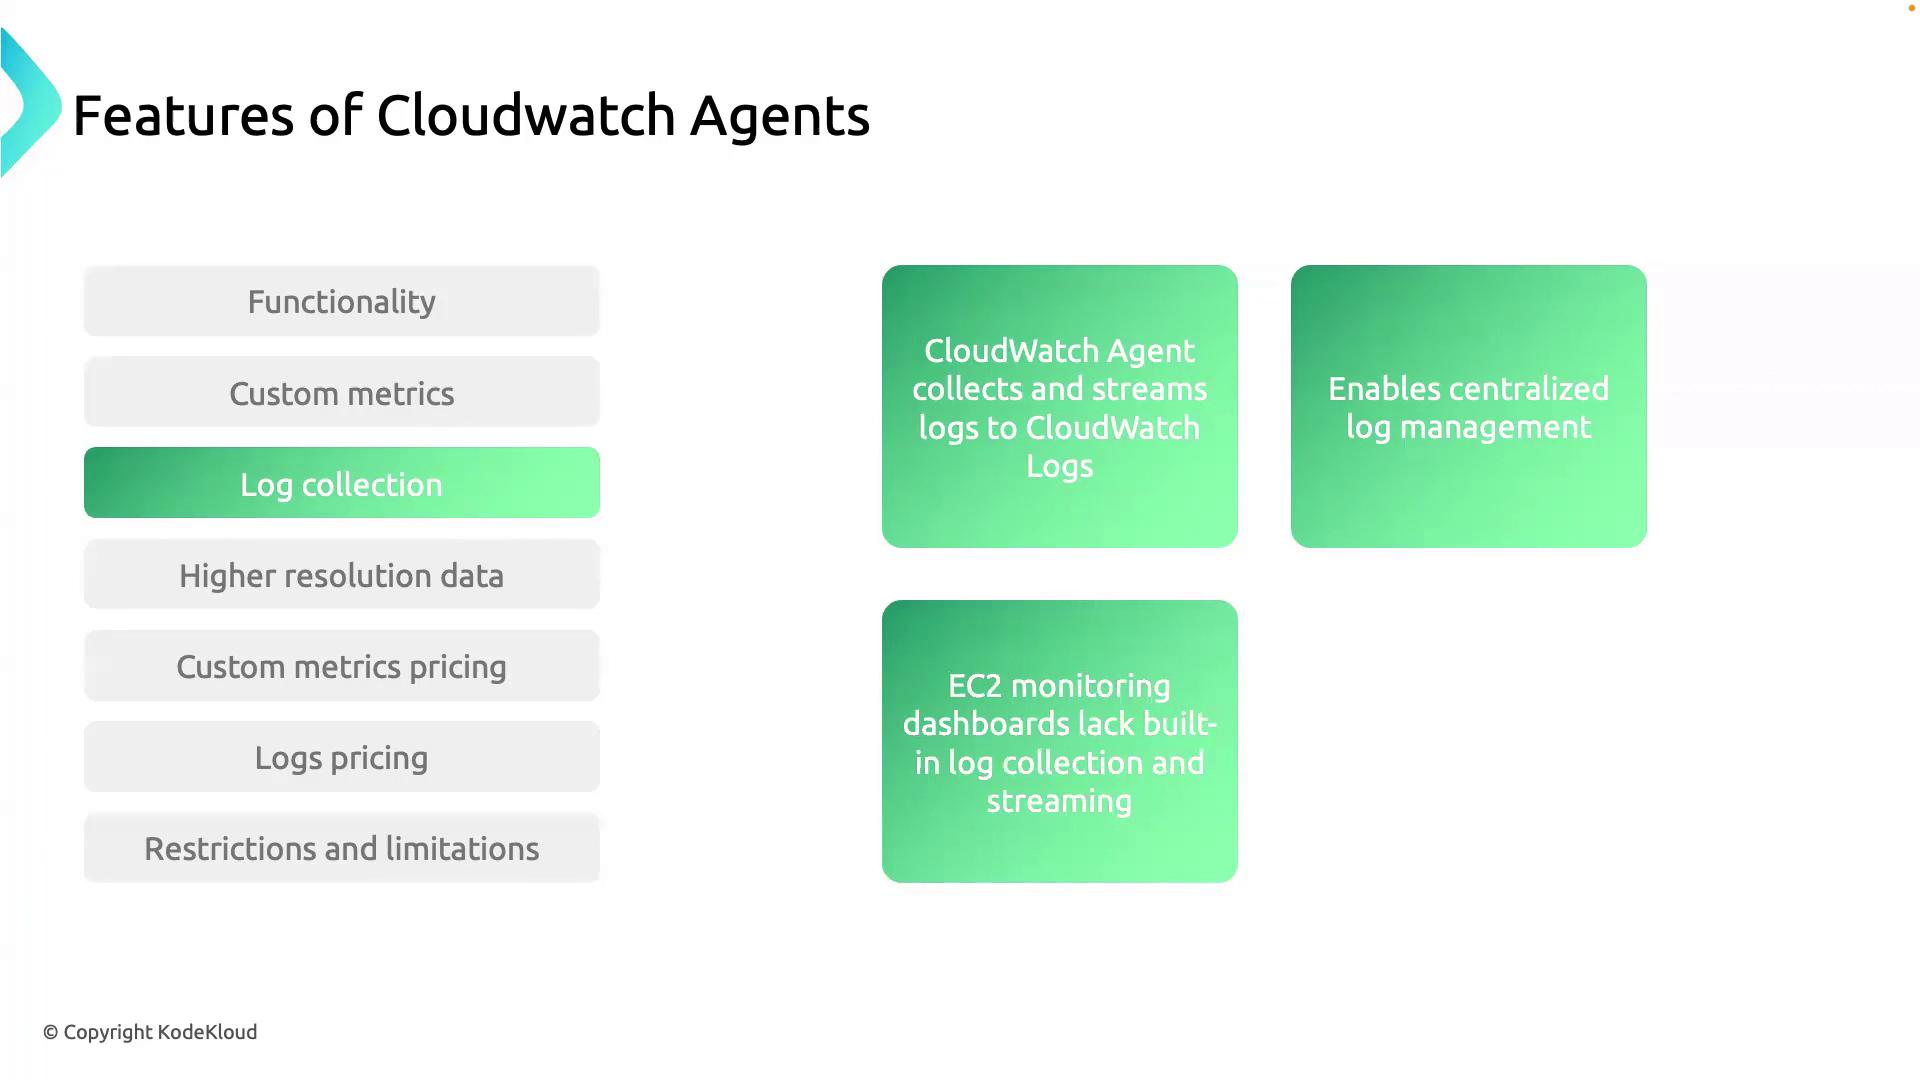
Log Collection
With simple configuration, the agent tails specified log files and streams entries directly to CloudWatch Logs. Centralized log management enables you to:- Search and filter across all logs
- Run Log Insights queries for troubleshooting
- Generate alerts on error patterns
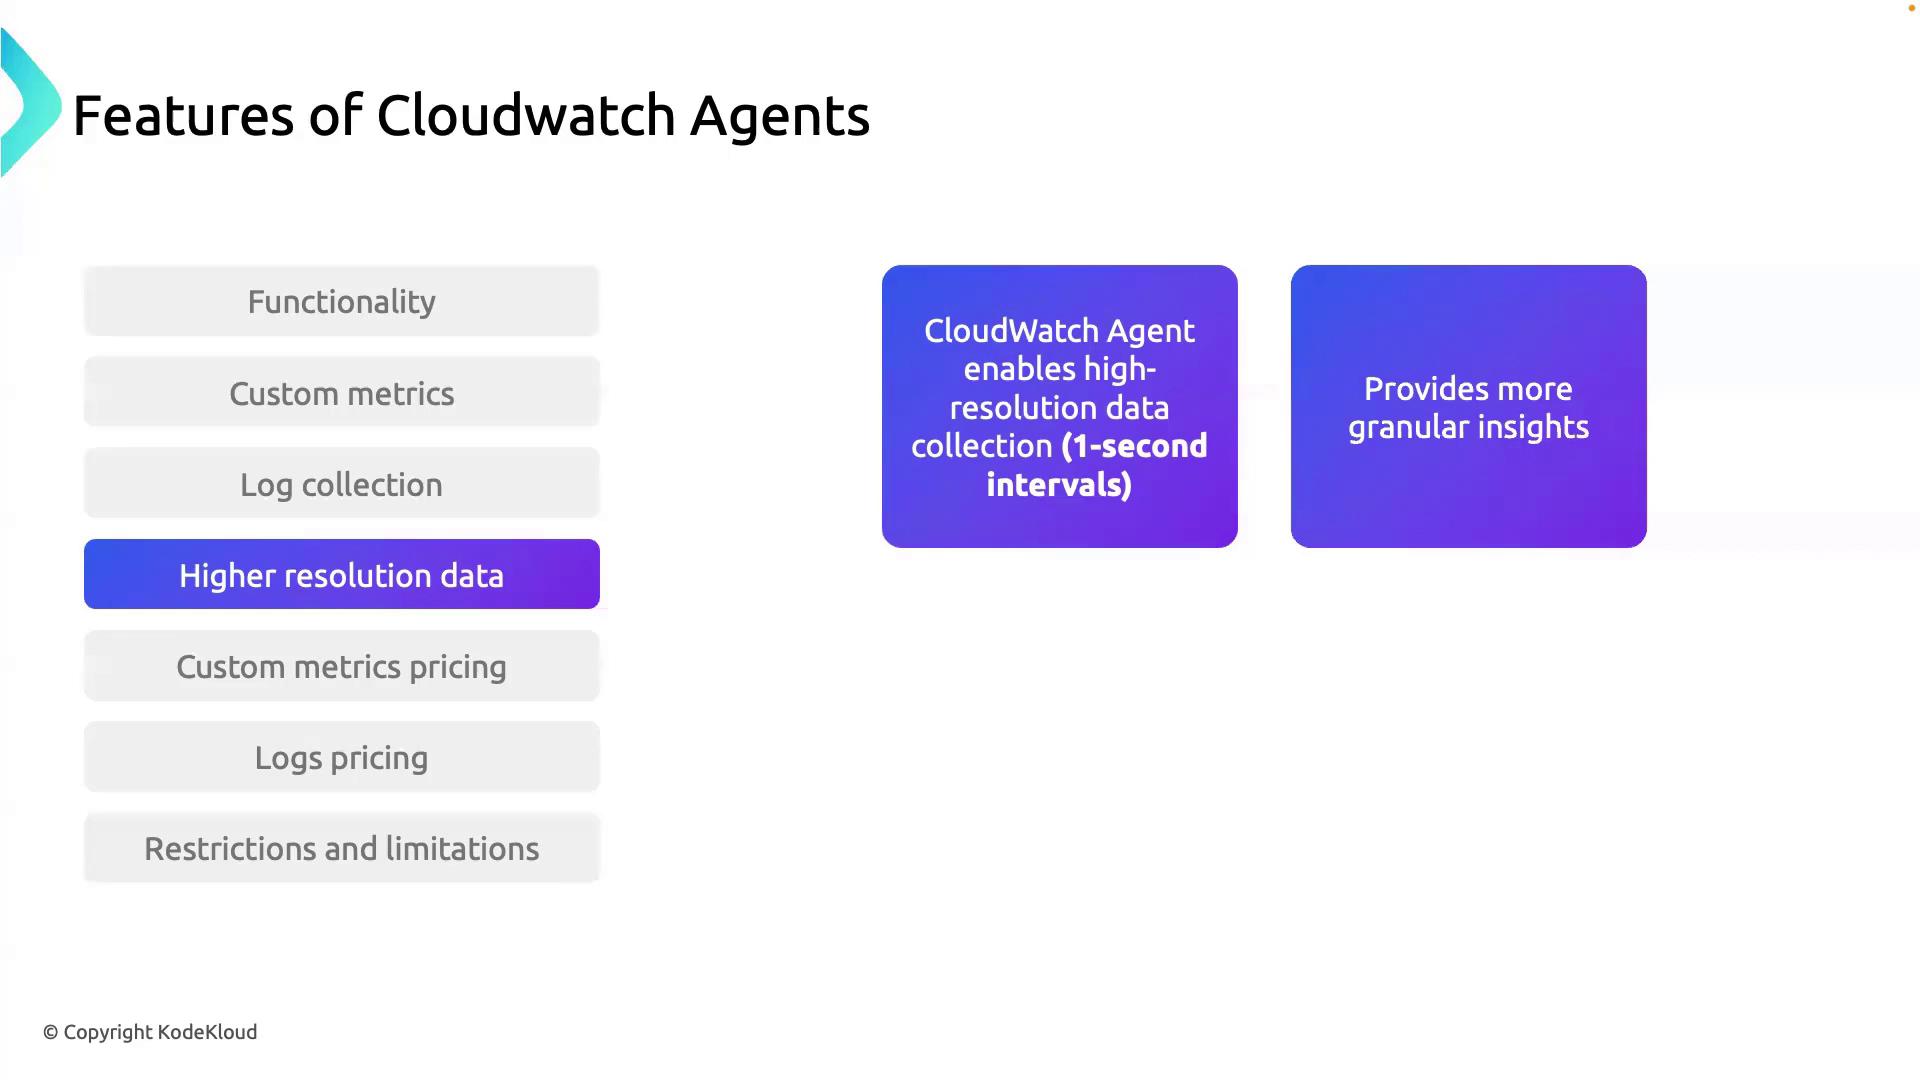
High-Resolution Data
For performance-sensitive workloads, the agent captures metrics at 1-second intervals—a 300× improvement over the default. High-resolution data helps you:- Detect transient spikes in CPU, memory, or I/O
- Tune autoscaling policies more precisely
- Troubleshoot performance degradation quickly
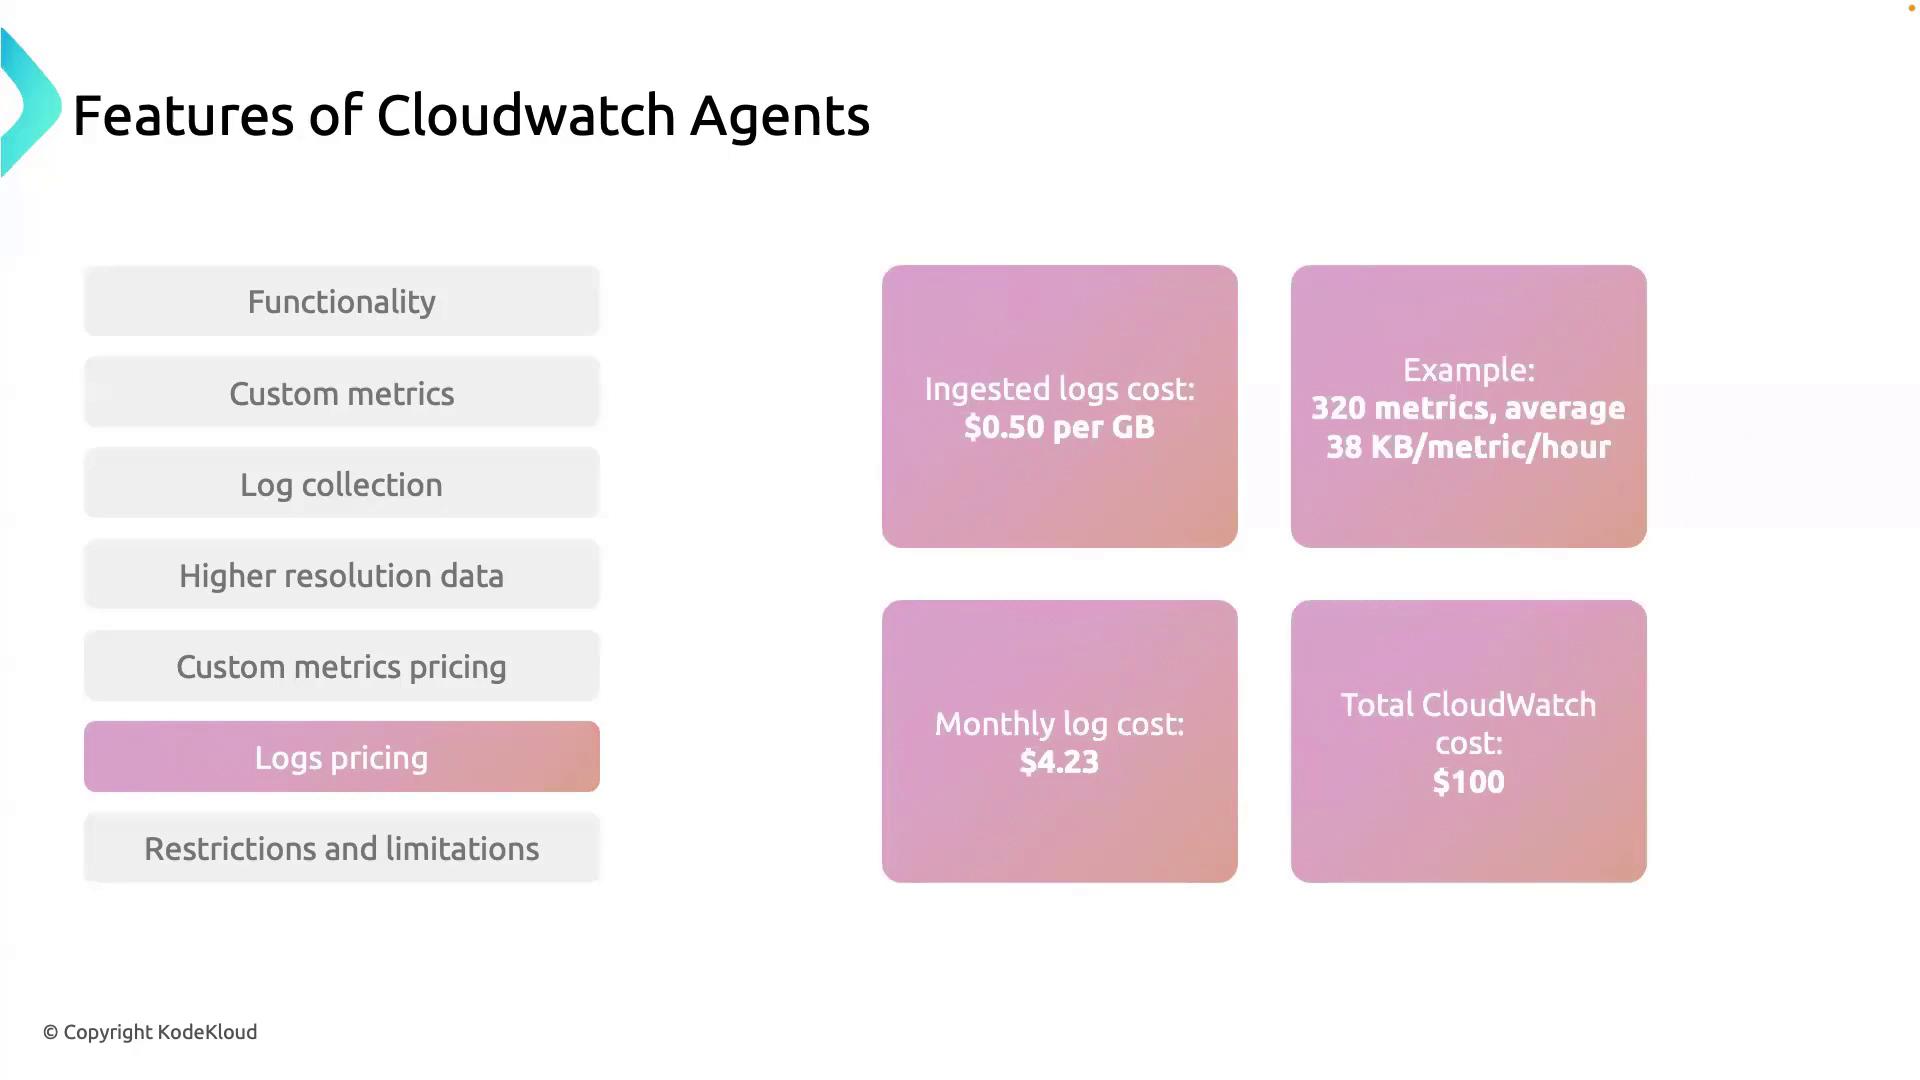
Pricing Overview
Using the CloudWatch Agent incurs minimal incremental costs:| Resource | Pricing |
|---|---|
| Custom metrics | $0.30 per metric per month |
| Logs ingestion | $0.50 per GB ingested |
- 320 custom metrics → 320 × 96
- 10 GB logs ingested → 10 × 5
- Total ~ $101
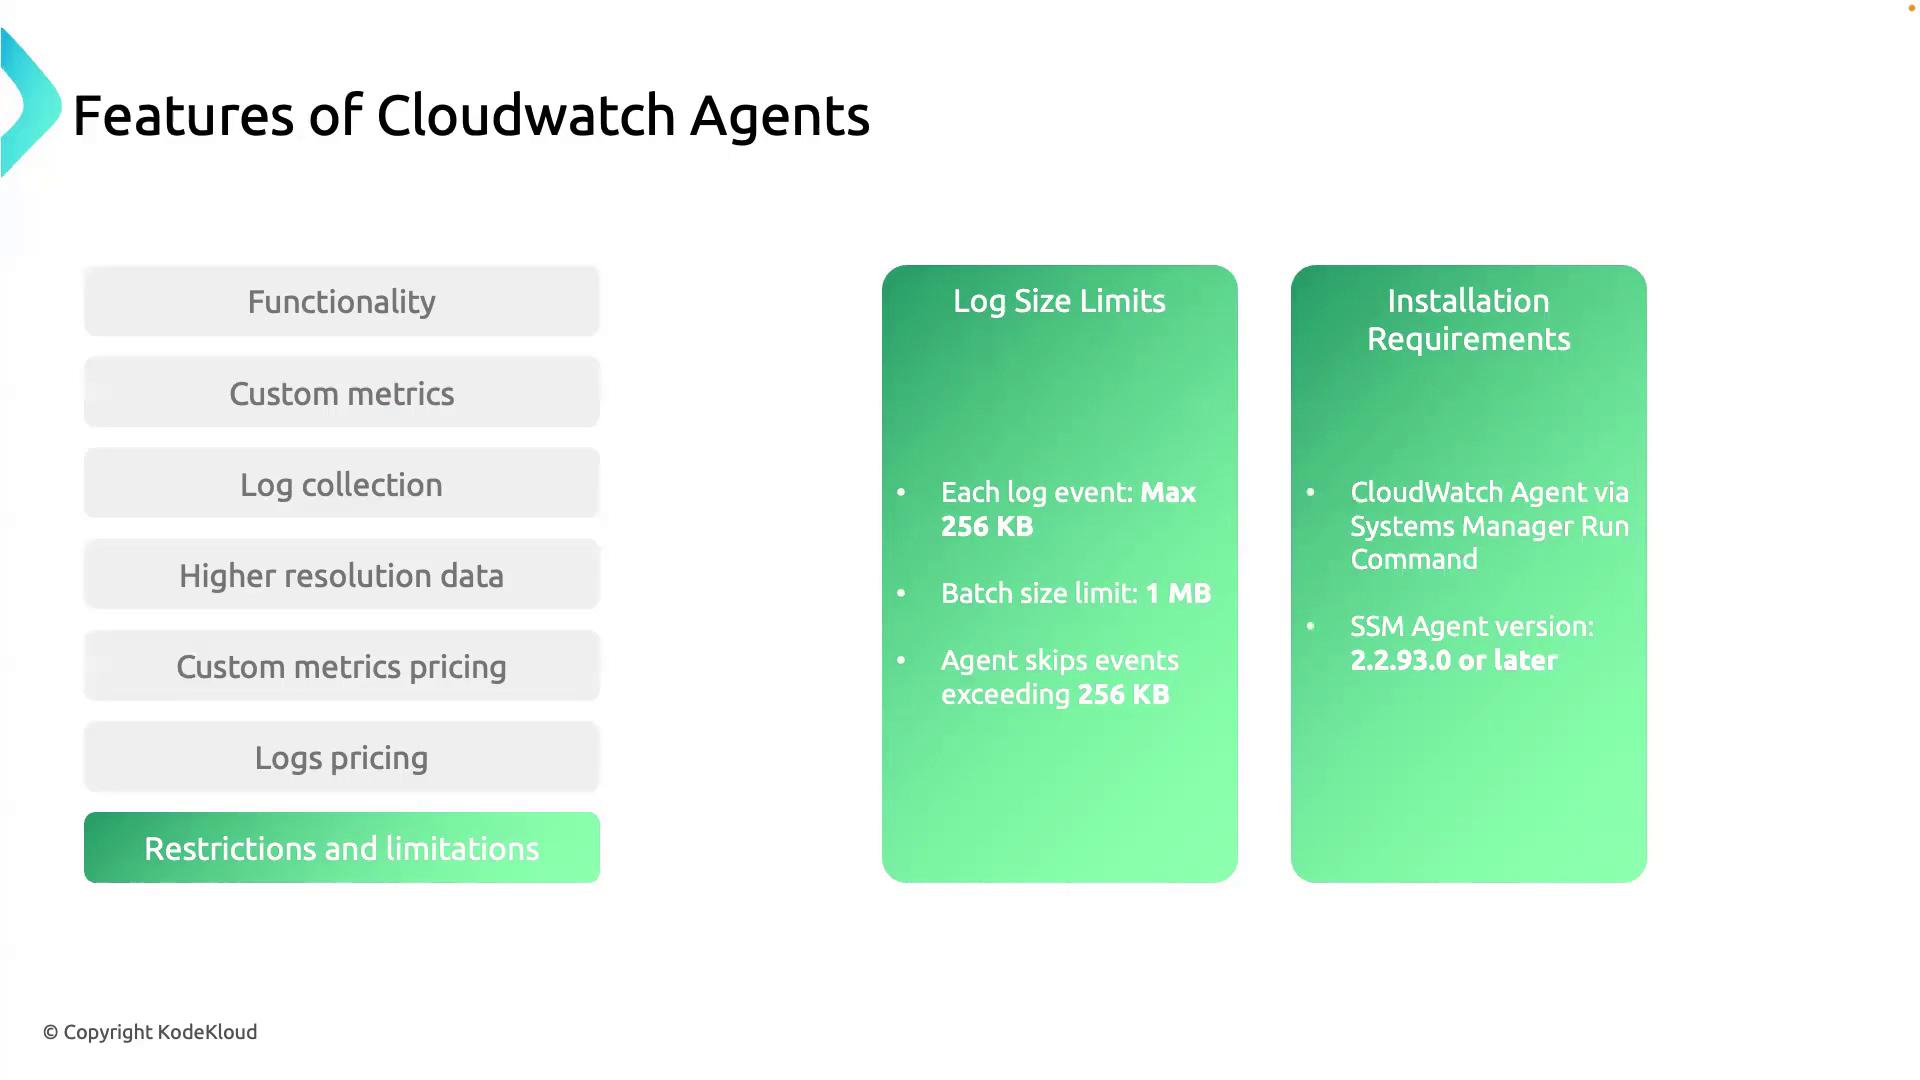
Agent Restrictions
Be aware of these limitations when deploying the CloudWatch Agent:- Log event size limit: Each log event must be ≤ 256 KB and batch requests cannot exceed 1 MB.
- SSM Agent requirement: To install via AWS Systems Manager, the SSM Agent must be version ≥ 2.2.93.
Events larger than 256 KB are skipped. Ensure your application splits large log entries before shipping.
If your instance runs an older SSM Agent, update it to version ≥ 2.2.93 before installing the CloudWatch Agent.
That wraps up our overview of the AWS CloudWatch Agent. In the next hands-on section, you’ll learn to install the agent on an EC2 instance and begin streaming custom metrics and logs.