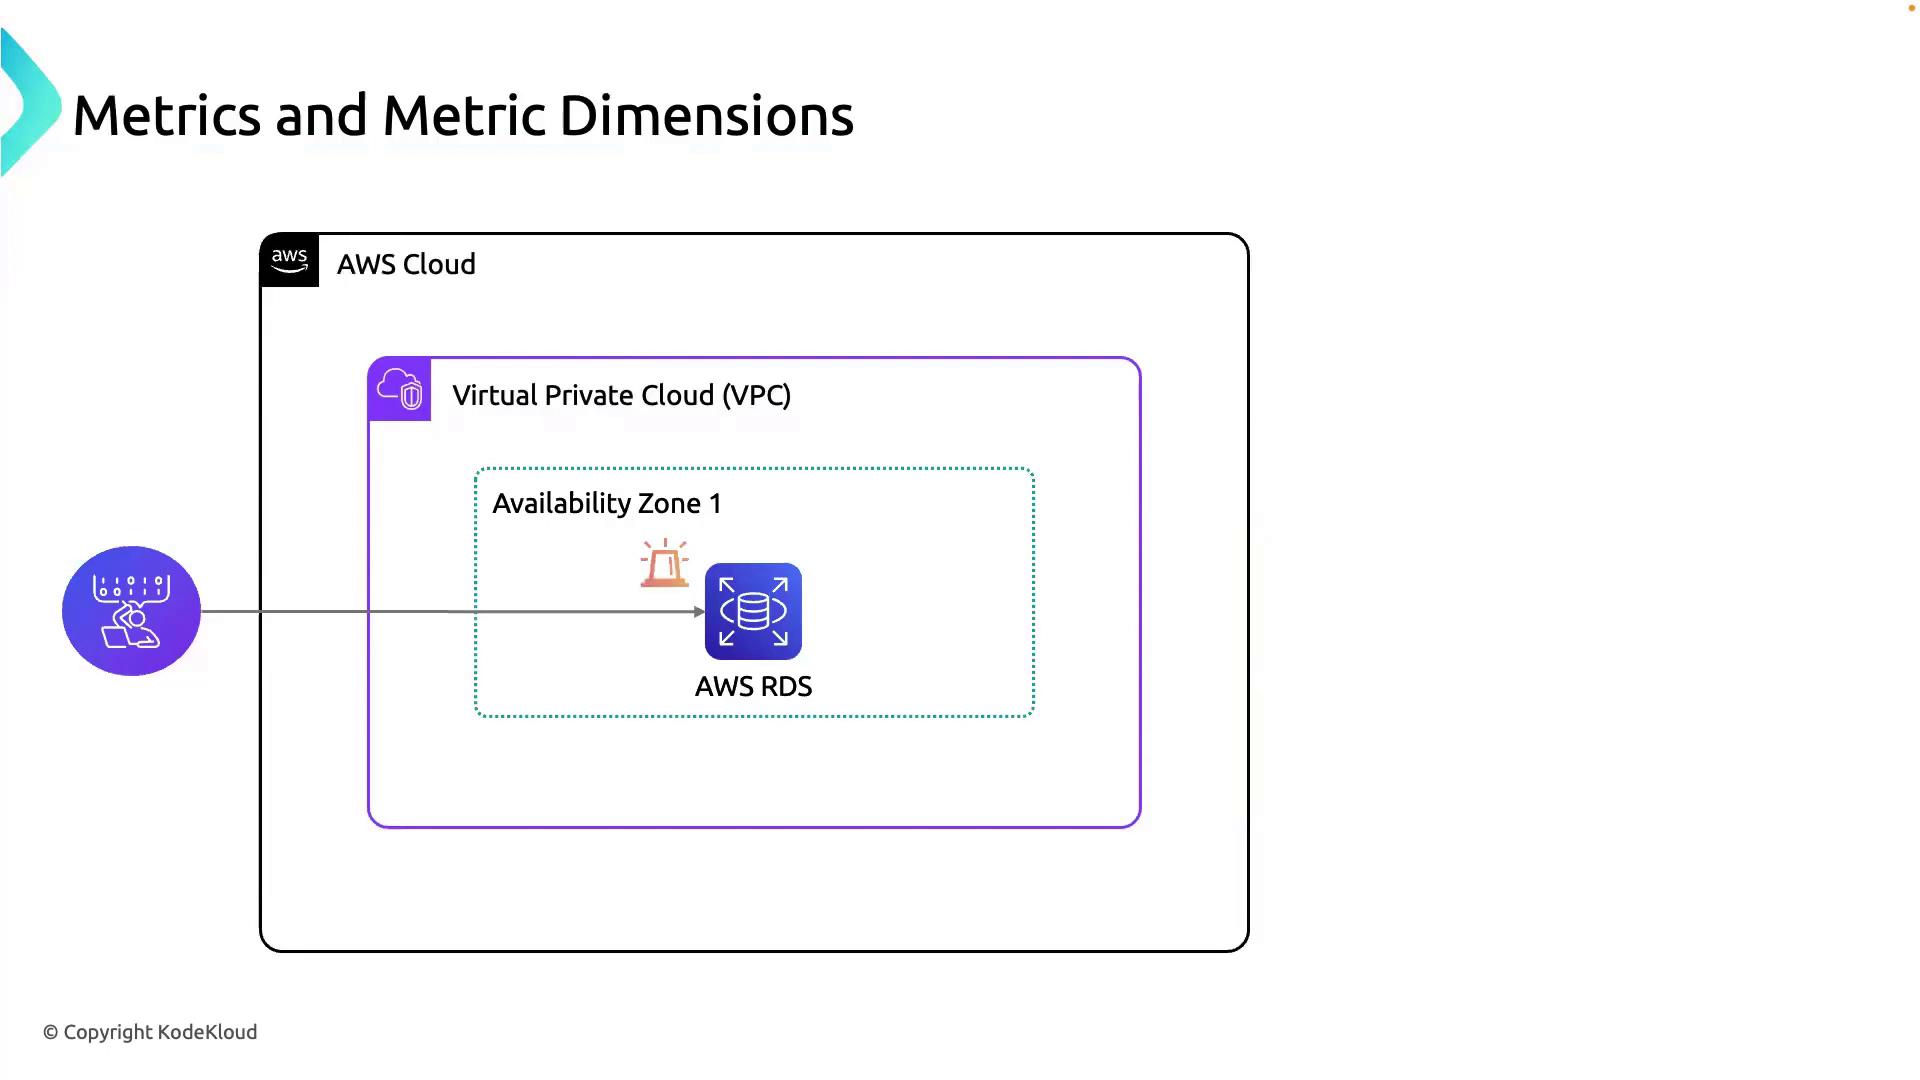
- You manage an AWS environment spanning a VPC and an Availability Zone.
- An RDS instance supports your application.
- You receive an alert about unusual performance on the RDS instance.
What Is a Metric?
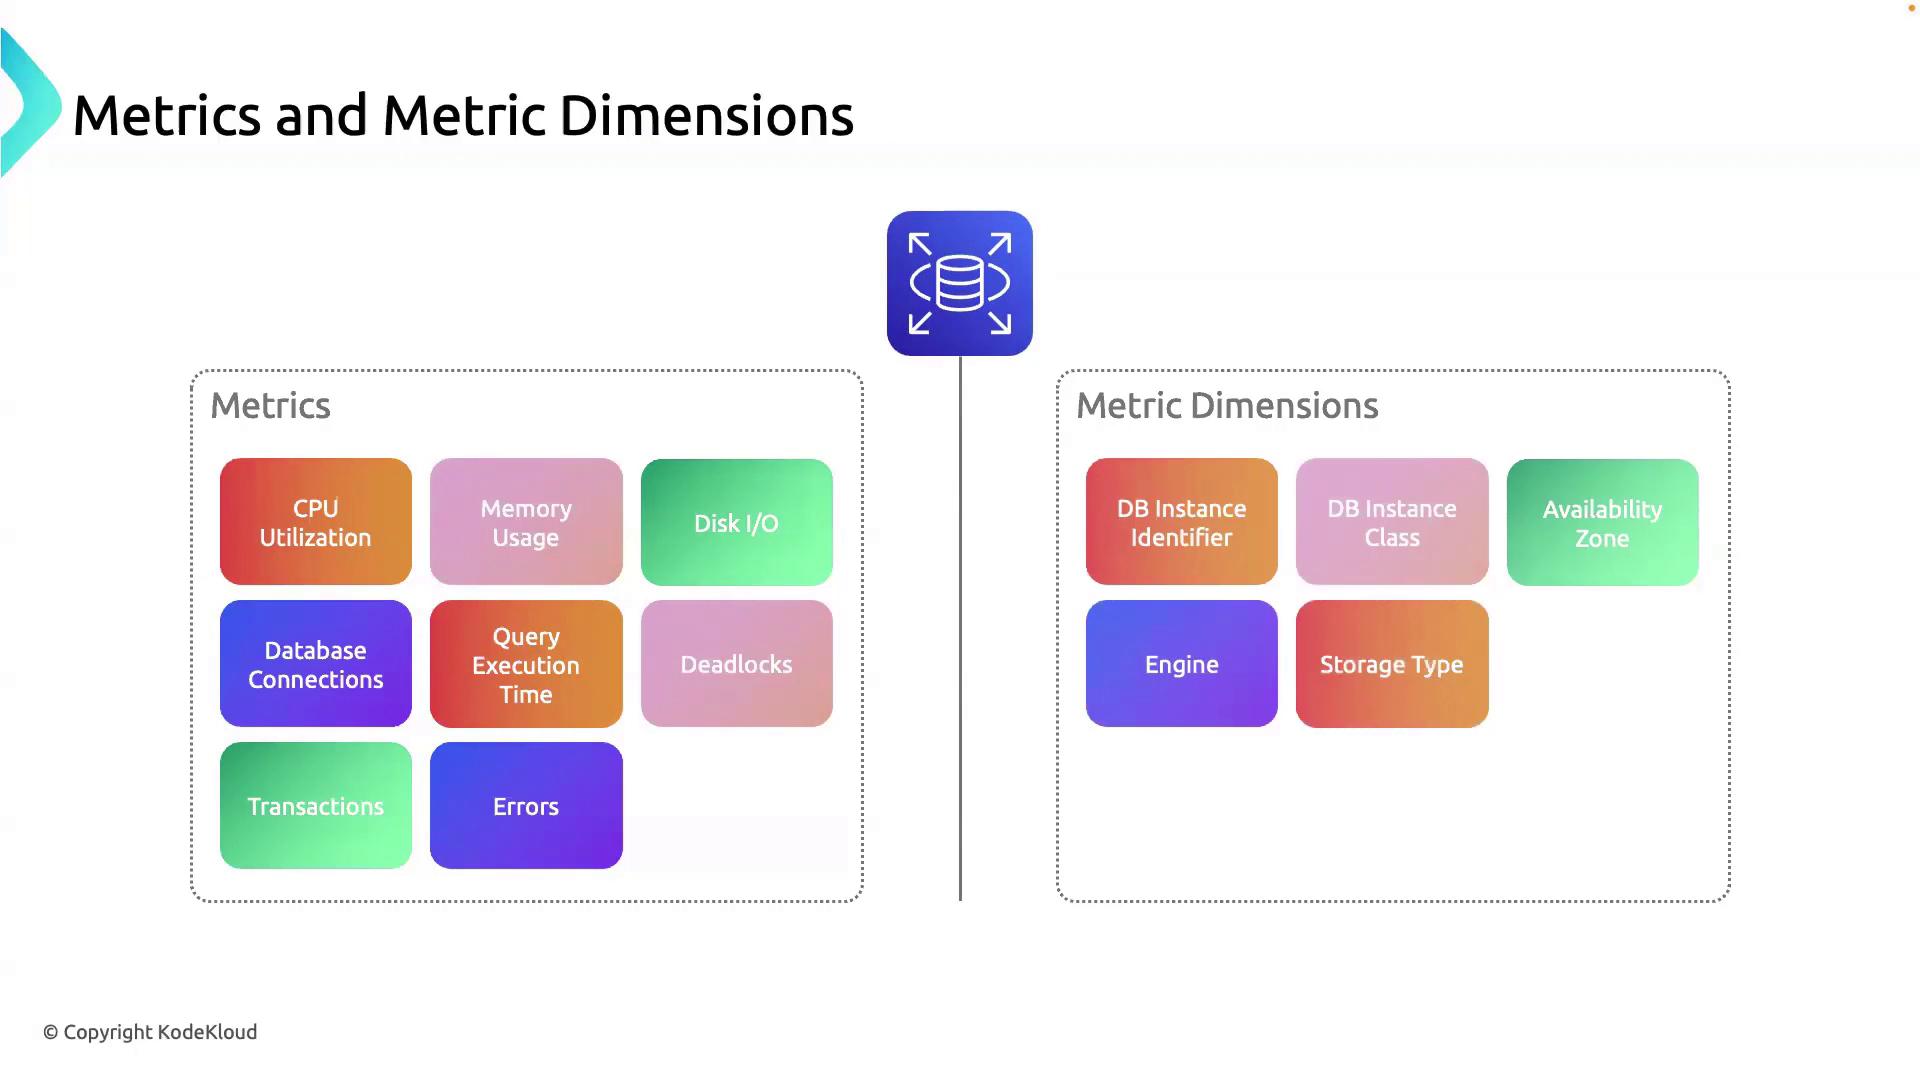
A metric is a time-ordered set of data points that quantify resource performance or utilization. In Amazon RDS, key metrics include:| Metric Name | Description |
|---|---|
| CPUUtilization | Percentage of CPU in use |
| FreeableMemory | Available memory in bytes |
| DiskQueueDepth | Number of pending I/O requests |
| DatabaseConnections | Active connections to the database |
Metrics answer what is happening. To pinpoint where or which resource is affected, use metric dimensions.
What Are Metric Dimensions?
A metric dimension adds context by specifying attributes that identify the source of a metric. Dimensions help you filter, group, and drill down into your monitoring data. Typical RDS dimensions:| Dimension | Description |
|---|---|
| DBInstanceIdentifier | Identifier of the RDS instance (e.g., app-db-01) |
| EngineName | Database engine type (e.g., MySQL, PostgreSQL) |
Example: Identifying a Stressed Instance
If CPU utilization spikes:Using too many high-cardinality dimensions (many unique values) can increase CloudWatch costs. Select dimensions judiciously.
That wraps up our overview of metrics and metric dimensions. In the next lesson, we’ll configure alarms and notification channels in AWS CloudWatch to automate your monitoring. Stay tuned!