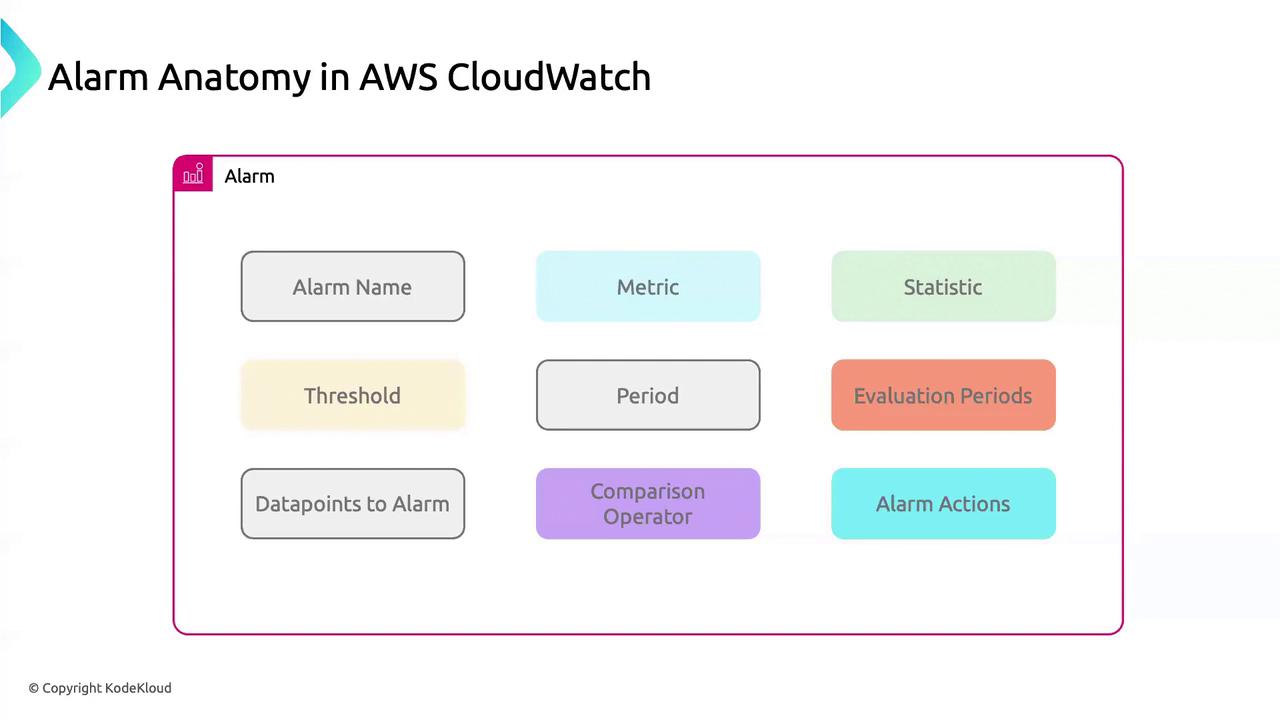
Core Components of a CloudWatch Alarm
| Component | Description |
|---|---|
| Alarm Name | A concise, unique identifier to locate and manage your alarm efficiently. |
| Metric | The AWS metric (e.g., CPUUtilization) you want to monitor. |
| Statistic | Aggregation method: Average, Minimum, Maximum, Sum, or SampleCount. |
| Threshold | Numerical value that triggers the alarm when crossed. |
| Period | Evaluation interval in seconds (e.g., 60, 300, 900). |
| Evaluation Periods | Number of consecutive periods the threshold must be breached before triggering. |
| Datapoints to Alarm | How many of those evaluation periods must breach the threshold to fire the alarm. |
| Comparison Operator | Comparison type: GreaterThanThreshold, LessThanOrEqualToThreshold, etc. |
| Alarm Actions | Actions on state change: SNS notification, Lambda invocation, Auto Scaling, etc. |
Example: Creating an Alarm for RDS CPU Utilization
Apply these settings to keep tabs on an Amazon RDS instance’s CPU usage: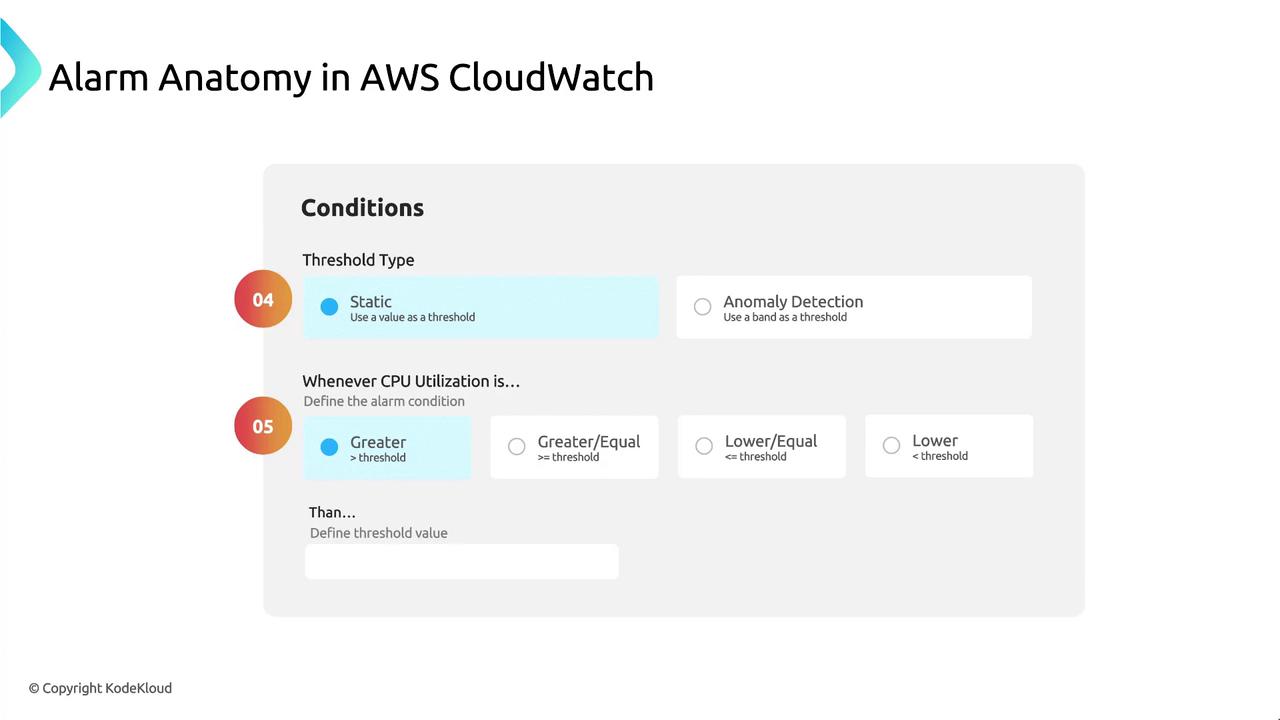
Consider using anomaly detection thresholds for dynamic baselines instead of static thresholds.
Avoid setting low thresholds with short evaluation periods—this can generate noise from transient spikes. Tune
EvaluationPeriods and DatapointsToAlarm for stability.Notification Settings
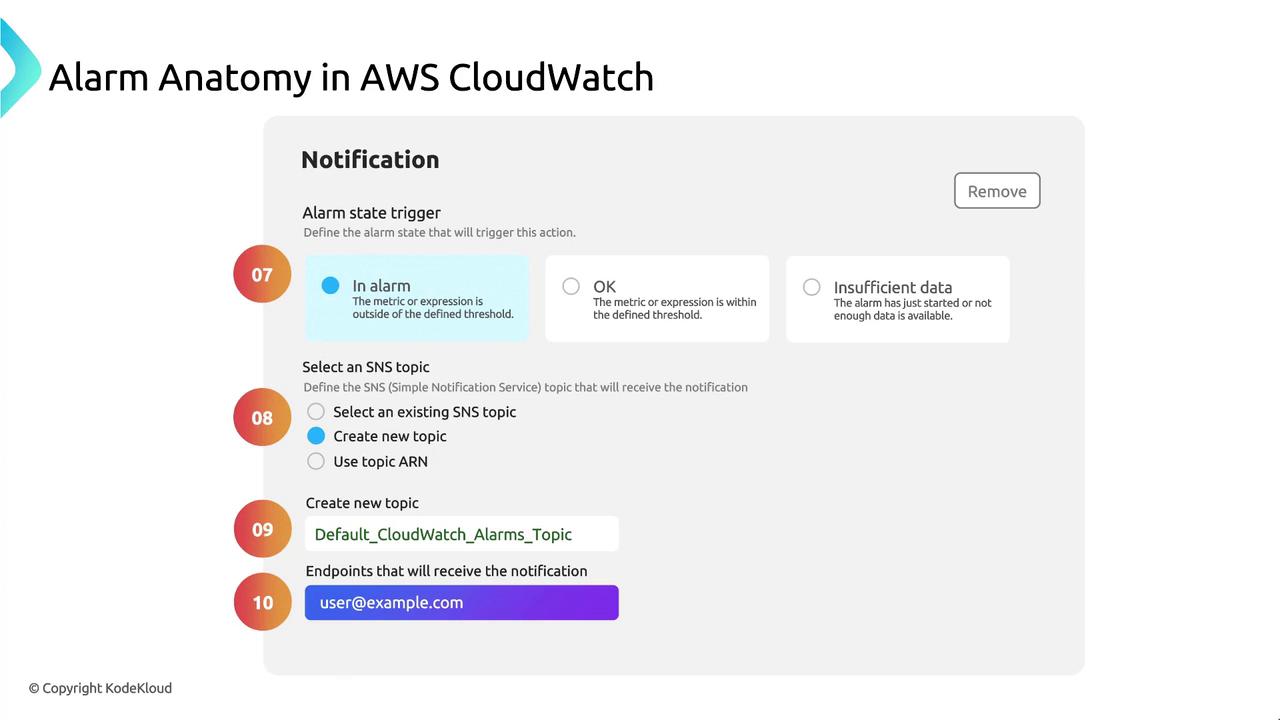
Define how CloudWatch alerts you when the alarm state changes:| Setting | Description |
|---|---|
| Alarm State | Triggers when the alarm enters ALARM state. |
| Notification | Delivery via an Amazon SNS topic. |
| SNS Topic | e.g., DefaultCloudWatchAlarms or a custom topic. |
| Endpoint | Email address, Lambda function ARN, or HTTP webhook. |