This article explains how to configure and use recording rules in Prometheus to enhance dashboard performance by precomputing metric data.
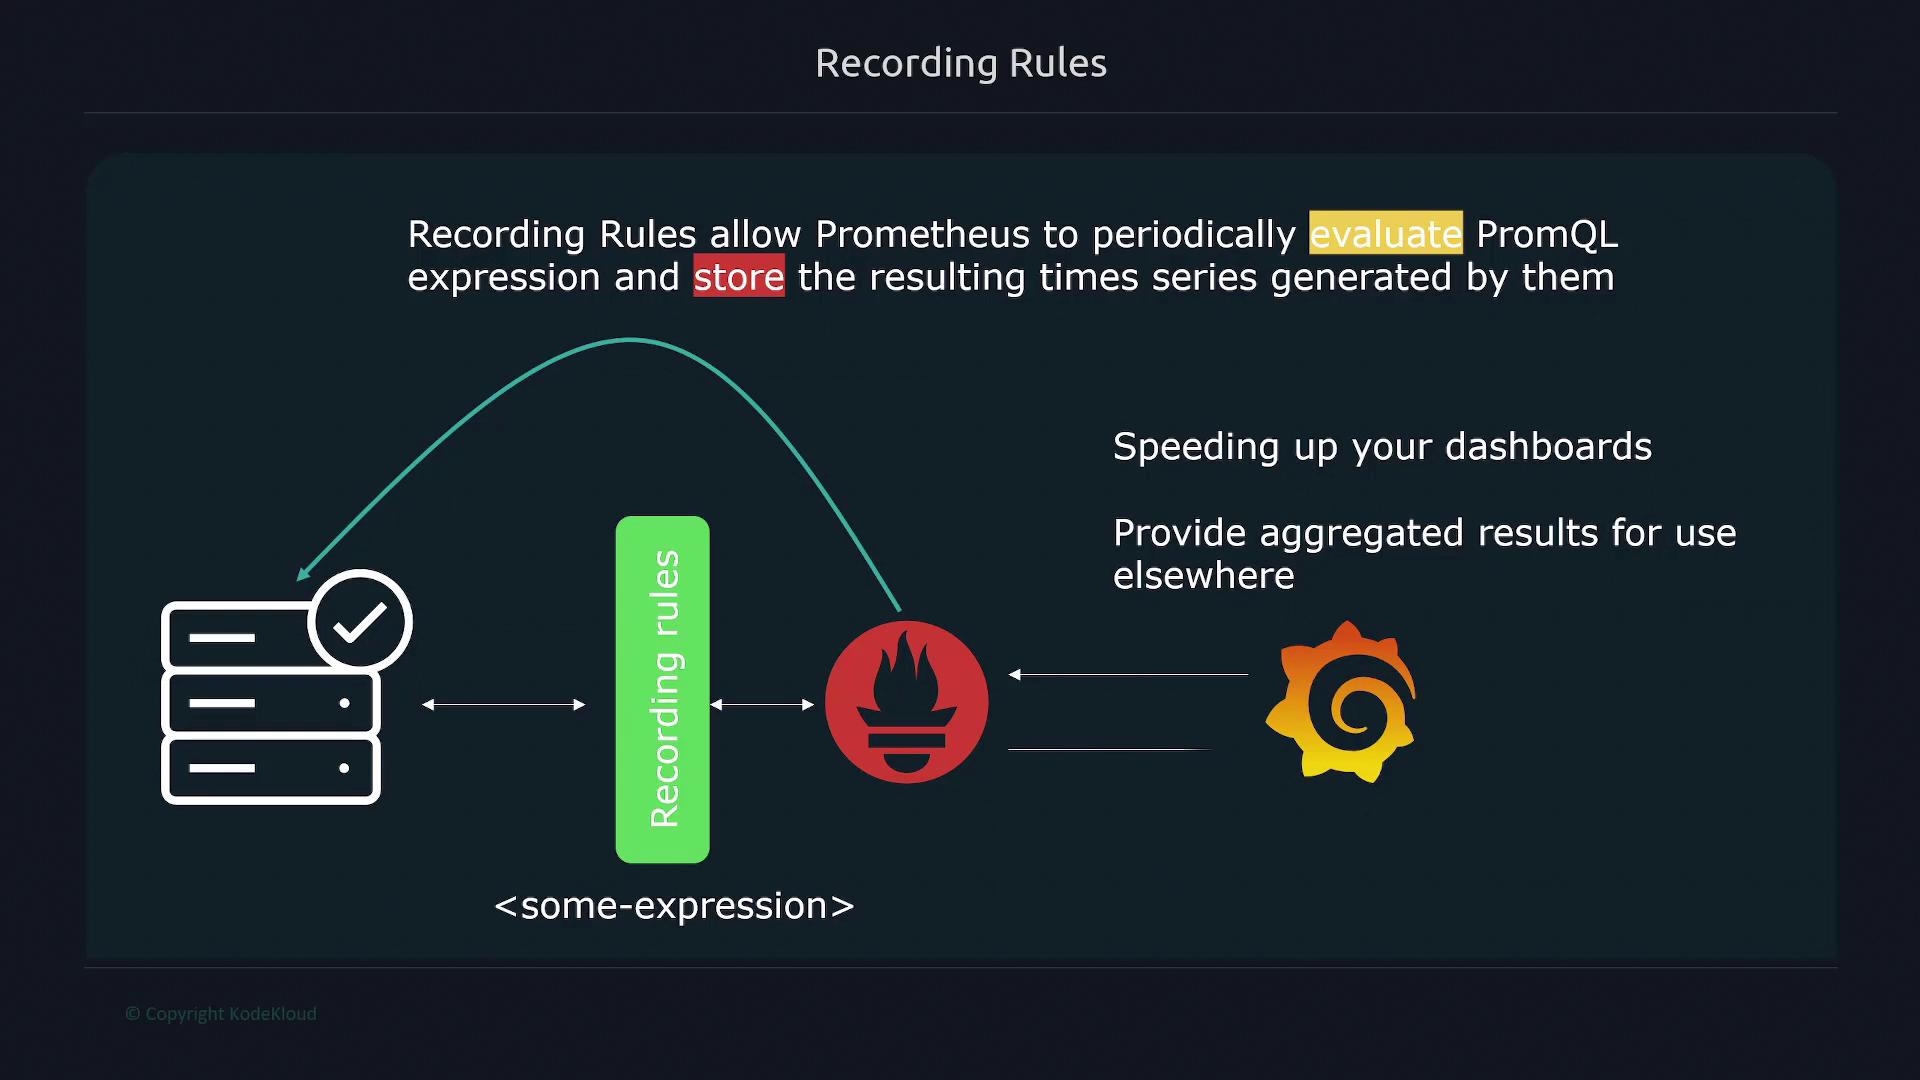
In this lesson, we explore recording rules in Prometheus, which allow the system to periodically evaluate PromQL expressions and store the results in its time series database. By precomputing metric data, recording rules significantly accelerate dashboard performance—whether using Grafana or Prometheus’ built-in UI—by eliminating on-the-fly calculations.
Before you configure recording rules, ensure that your Prometheus configuration file includes the correct reference to your rules file using the rule_files property.
To enable recording rules, you must define your rules in a separate file (commonly named rules.yml). Within your Prometheus configuration file, reference this file using the rule_files key. Prometheus then evaluates the specified expressions at a defined interval (such as every 30 seconds, minute, or any period you choose) and stores the results.Below is an example Prometheus configuration that includes a rules file:
You can also use glob patterns to automatically include multiple rule files from a directory. For instance, setting the rule file path as /etc/prometheus/rules/*.yaml instructs Prometheus to import all files ending with .yaml in that directory. Note that changes to rule files require a restart of the Prometheus server to take effect.
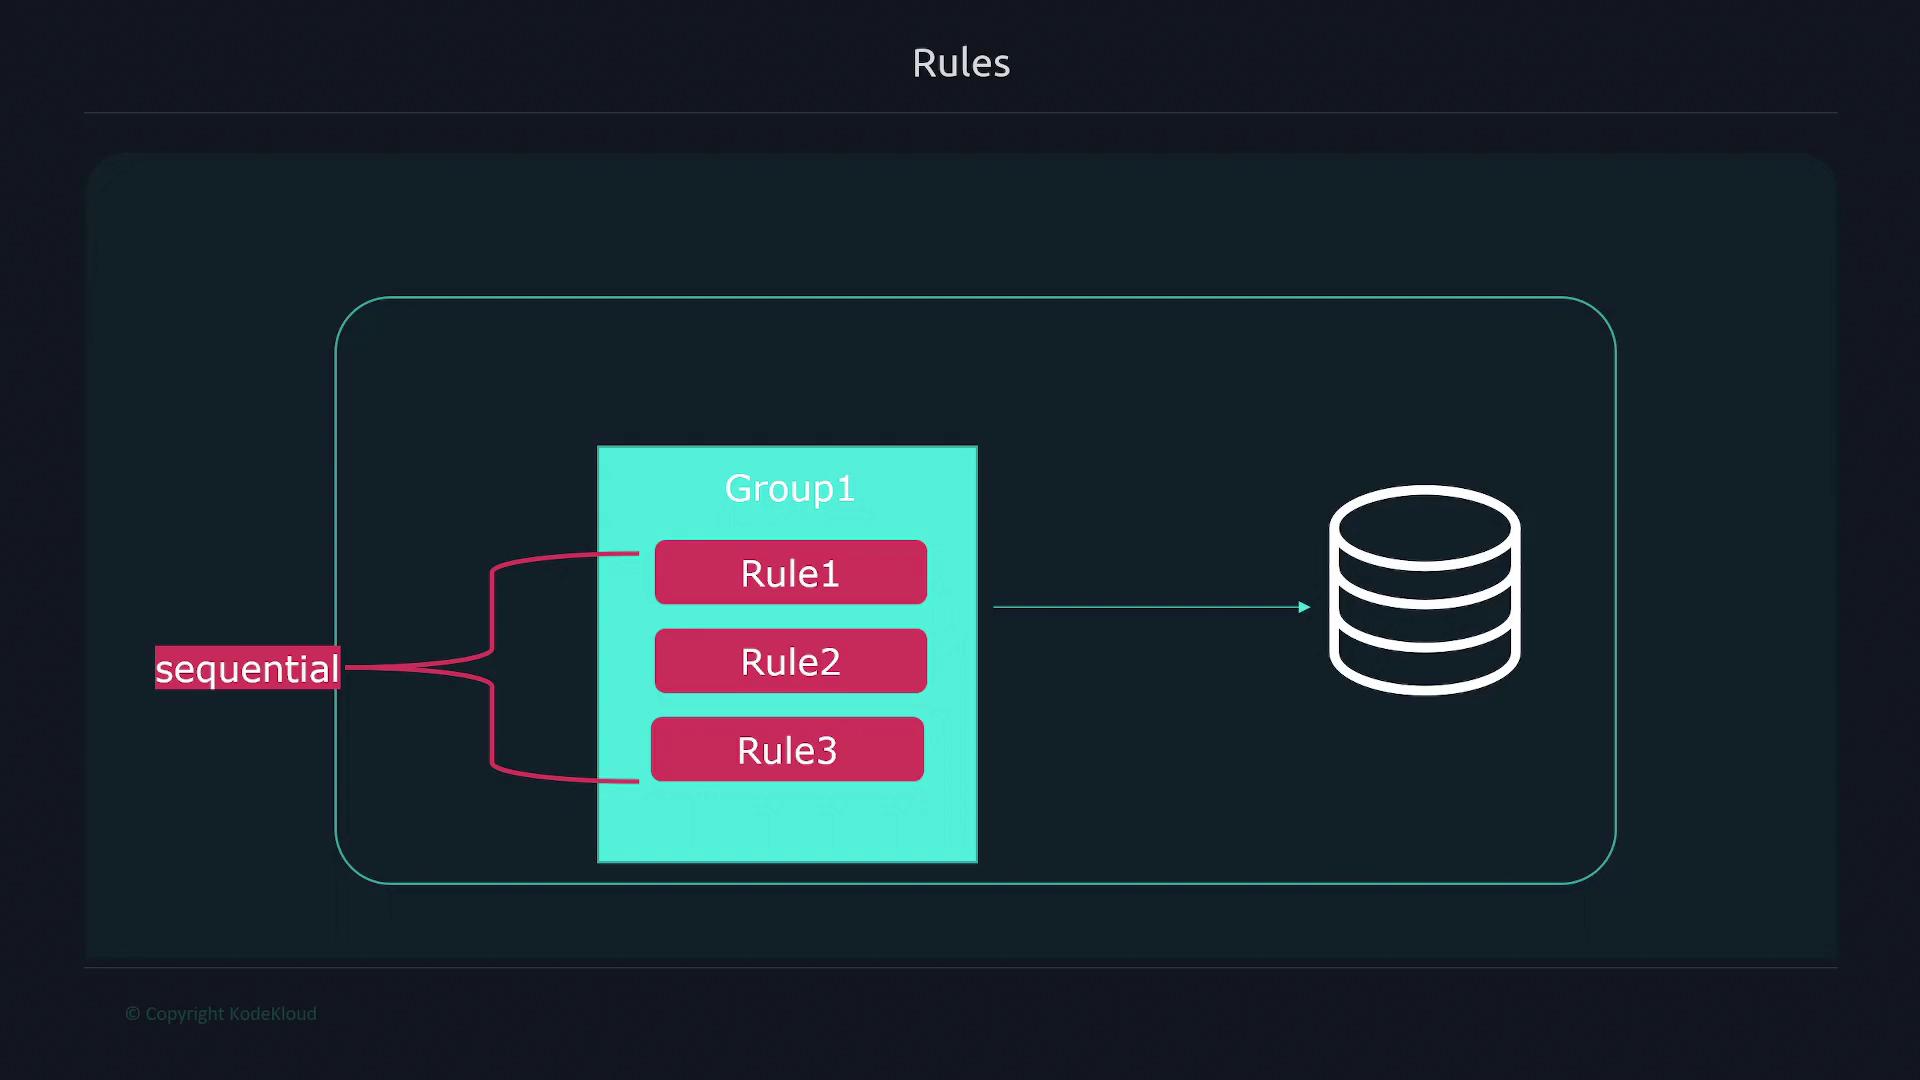
A rule file consists of one or more rule groups defined under the groups key. Each group can have an interval property that overrides the global evaluation interval, and the rules inside are executed sequentially. This sequential execution ensures that if one rule depends on the output of a previous rule, its dependency will be resolved correctly. However, different groups execute in parallel.Here is an example format for a rule file:
Copy
Ask AI
groups: - name: <group name 1> interval: <evaluation interval> rules: - record: <rule name 1> expr: <promql expression 1> labels: <label name>: <label value> - record: <rule name 2> expr: <promql expression 2> - name: <group name 2> rules: # Additional rules for group 2
For instance, consider recording two metrics: the percentage of free memory on a node and the percentage of free space on a filesystem. Instead of recalculating these expressions with every query, set up recording rules to compute these metrics periodically:
After configuring your rules, check their status by navigating to the “Status” tab and selecting “Rules” in the Prometheus interface. Each rule displays its state (OK or error).
When querying, simply use the rule’s name (e.g., node_memory_memFree_percent). Prometheus returns the precomputed value rather than executing the original expression. This not only speeds up the dashboard response time but also simplifies query formulation.You can also reference a recorded rule within another rule. For example, to compute the average free percentage across instances:
In this example, the first rule calculates the free percentage for each filesystem, and the second rule computes the average value by instance using the initial result. Thanks to sequential execution within the group, the second rule can safely reference the result of the first.
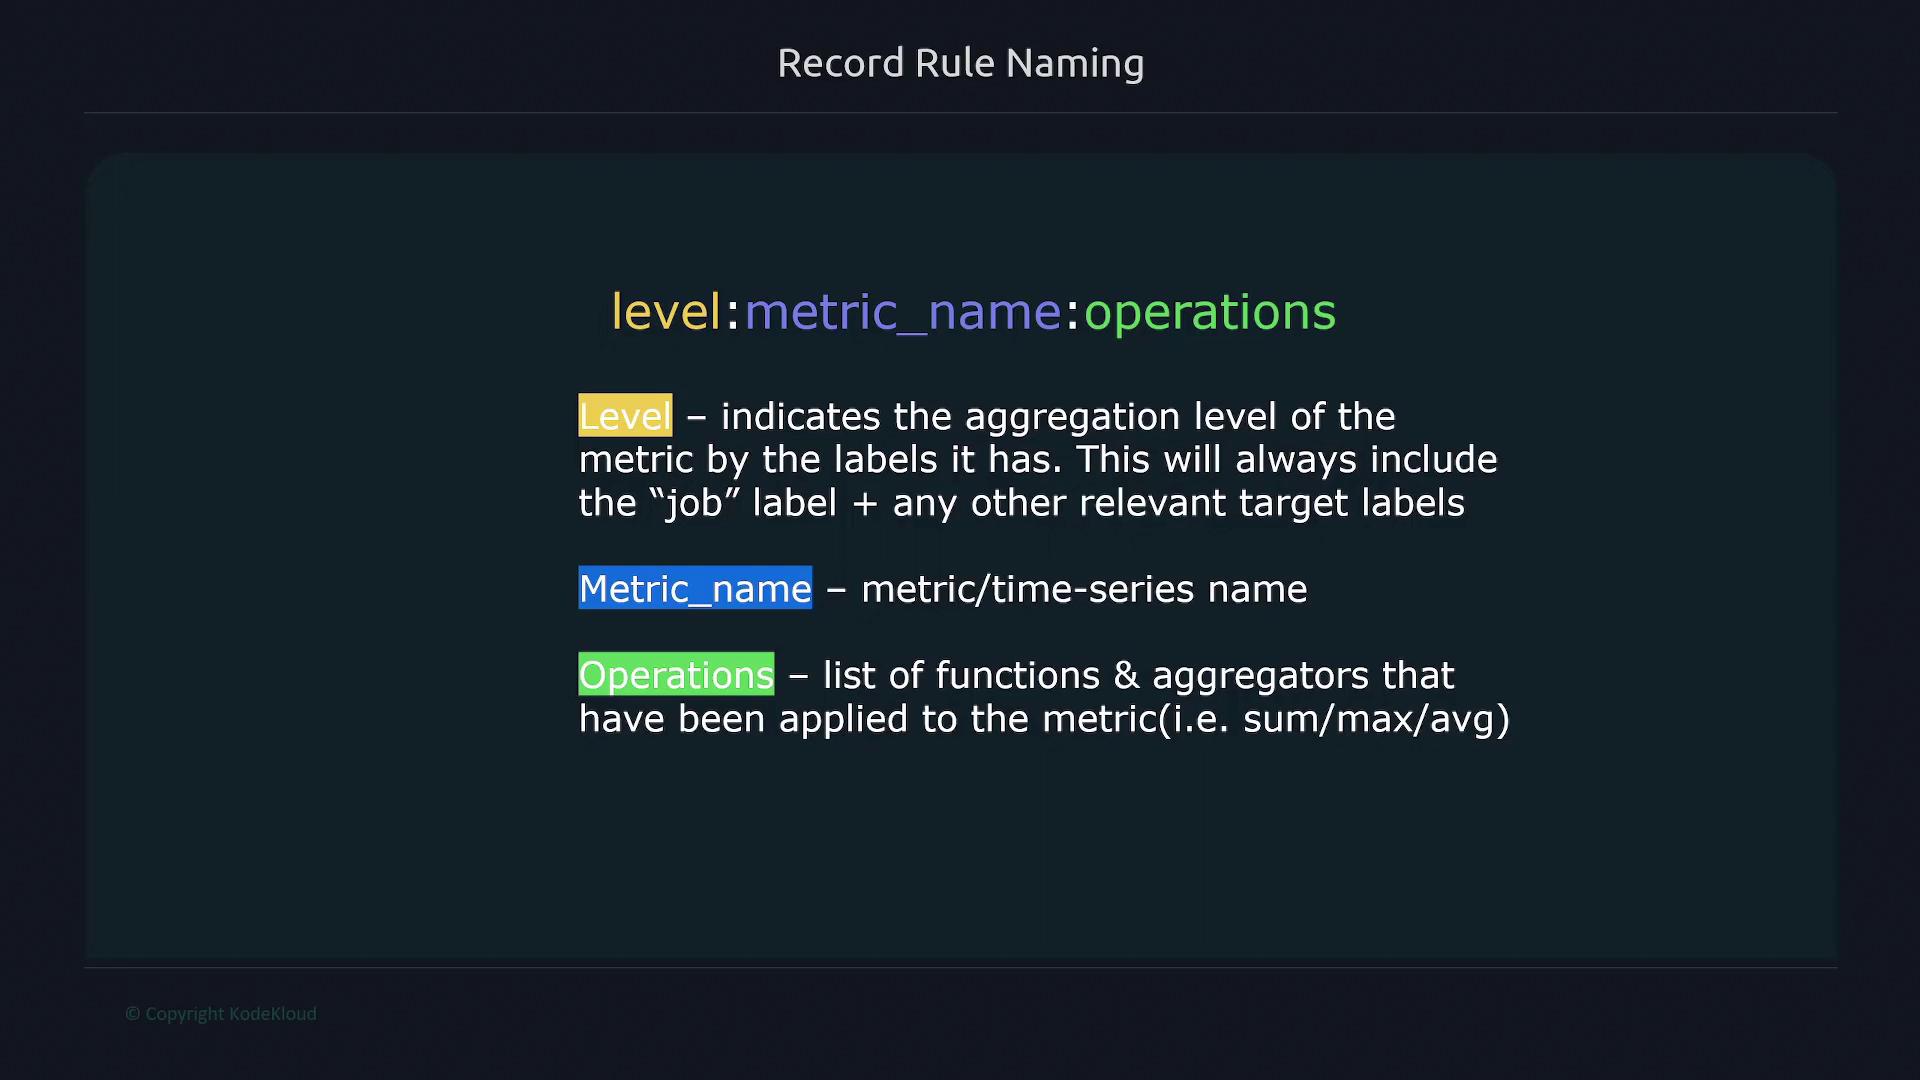
Adopting a clear naming convention helps maintain consistency and clarity. A suggested naming format breaks the name into three parts separated by a semicolon:
Level: Indicates the aggregation level based on labels (e.g., job, method, path).
Metric Name: The name of the metric.
Operations: Lists the functions or aggregators applied (e.g., rate, sum, avg).
The image below illustrates this naming convention:
For example, consider an HTTP errors counter with labels for method and path. To compute a 5-minute error rate, you could define the rule as follows:
Copy
Ask AI
- record: job_method_path:http_errors:rate5m expr: sum without(instance)(rate(http_errors{job="api"}[5m]))
Should you decide to remove the path label from the aggregation, update the rule accordingly:
Copy
Ask AI
- record: job_method:http_errors:rate5m expr: sum without(instance, path)(rate(http_errors{job="api"}[5m]))
Group all recording rules for the same job together. For instance, if you have separate rules for jobs “node” and “docker”, create distinct groups for each.
An example grouping by job:
Copy
Ask AI
groups: - name: node # All rules for job="node" interval: 15s rules: - record: node_memory_memFree_percent expr: 100 - (100 * node_memory_MemFree_bytes{job="node"} / node_memory_MemTotal_bytes{job="node"}) - name: docker # All rules for job="docker" interval: 15s rules: # Docker-specific rules go here
When multiple instances are present, separate data is returned for each instance.
This comprehensive guide on recording rules in Prometheus shows how you can precompute values and efficiently organize your rules to enhance dashboard performance and simplify your queries.For more detailed information, refer to the Prometheus Documentation.