- Deploy or edit containerized applications
- Monitor pod and deployment status
- View logs and resource usage
- Troubleshoot issues with real-time metrics
1. Accessing the Dashboard
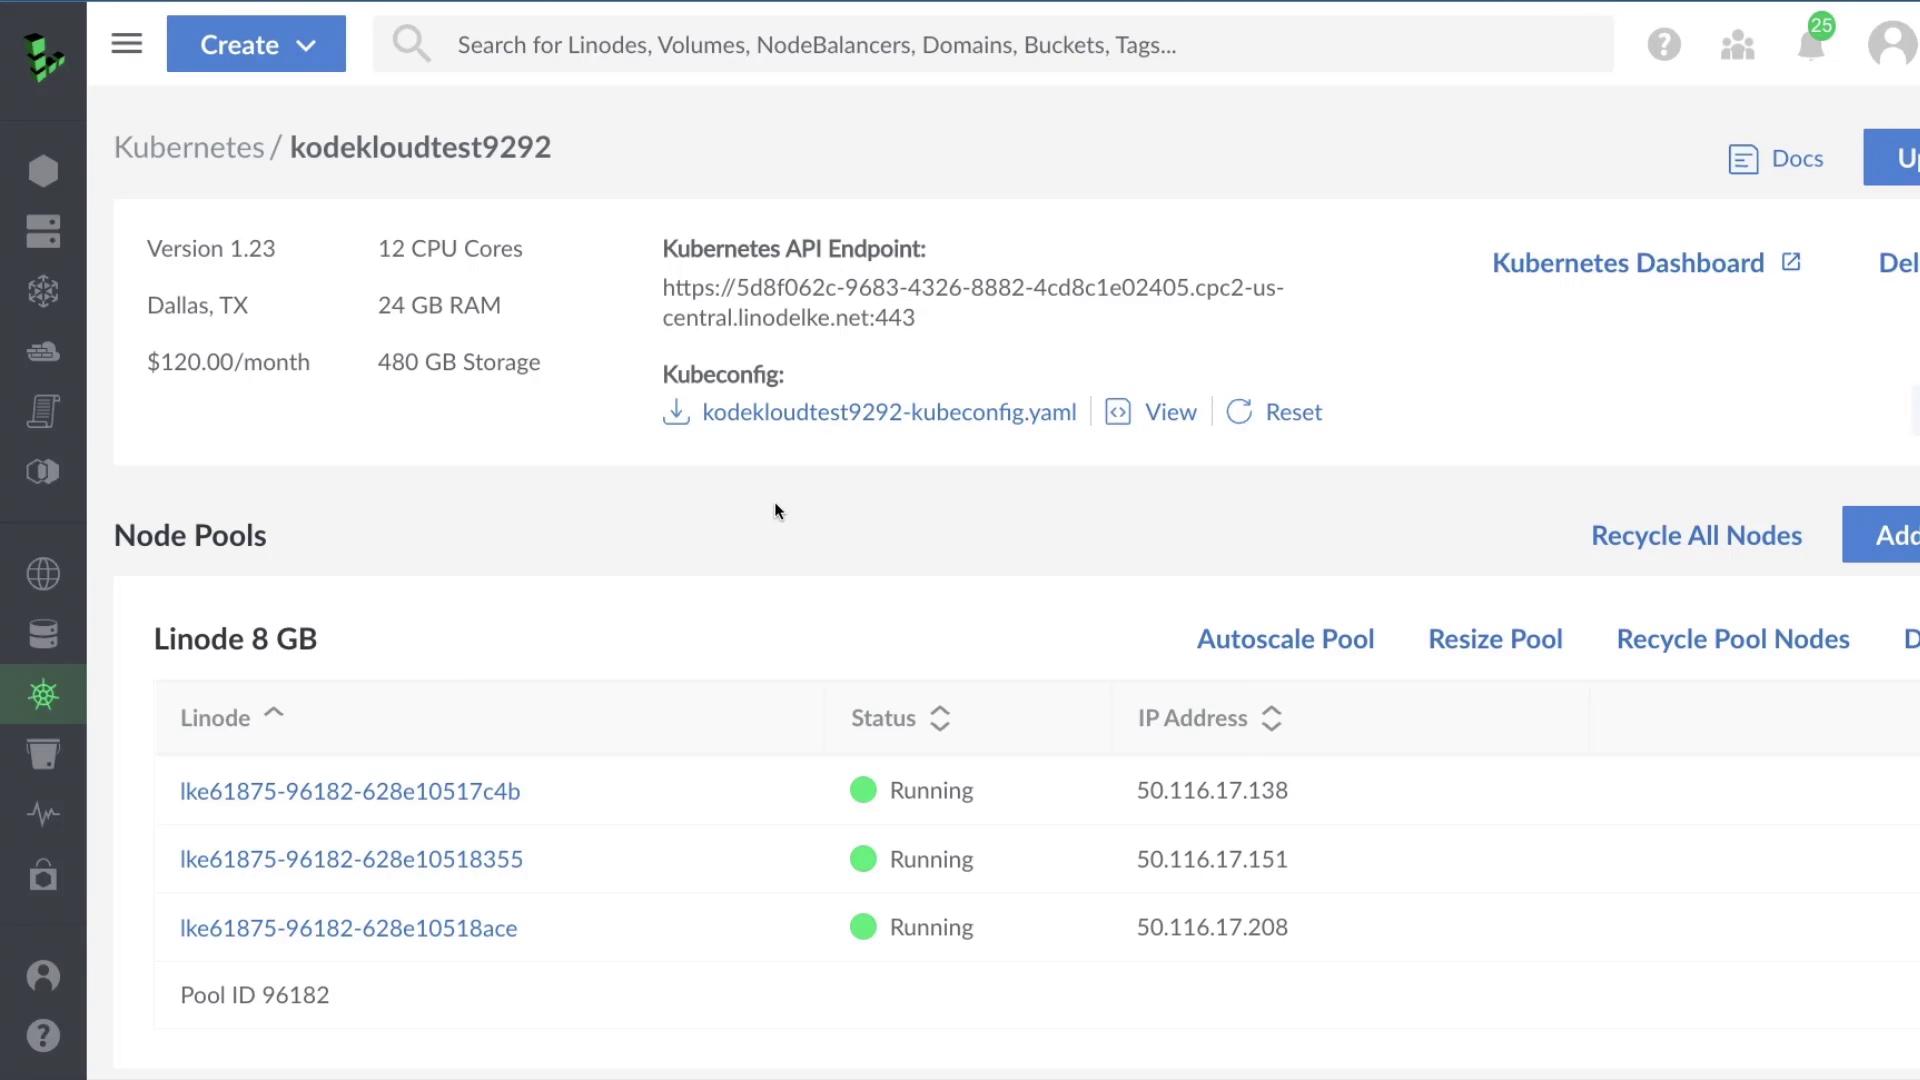
- Log in to the Linode Cloud Manager.
- Navigate to Kubernetes and select your cluster.
- Click Kubernetes Dashboard.
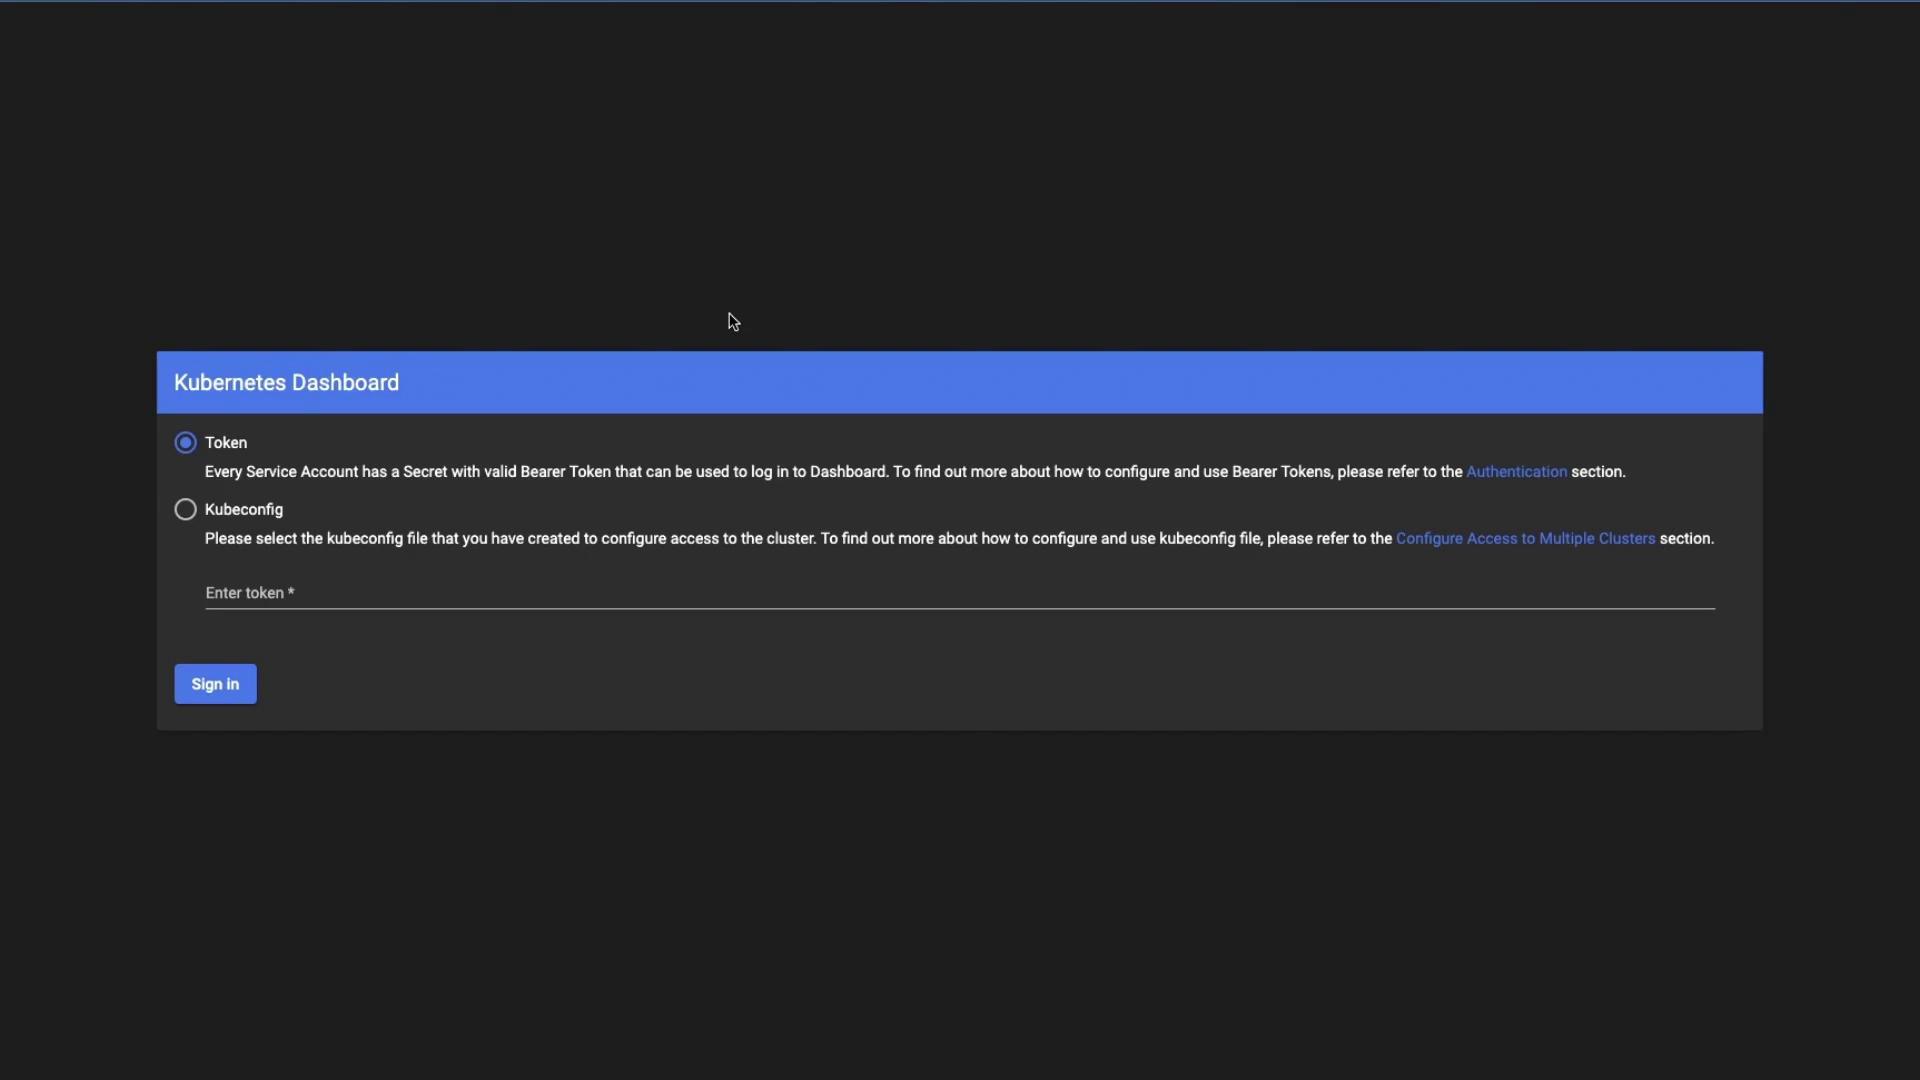
Authentication Methods
| Method | Steps |
|---|---|
| kubeconfig | Click the ⋮ menu, upload your local kubeconfig file, then Sign In. |
| Token | Copy the bearer token from Cloud Manager and paste it into the Token field below. |
Tokens are scoped by RBAC rules. Ensure your service account has the correct role bindings to view the resources you need.
2. Dashboard Overview
Upon first login (in thedefault namespace), you may see an empty view:
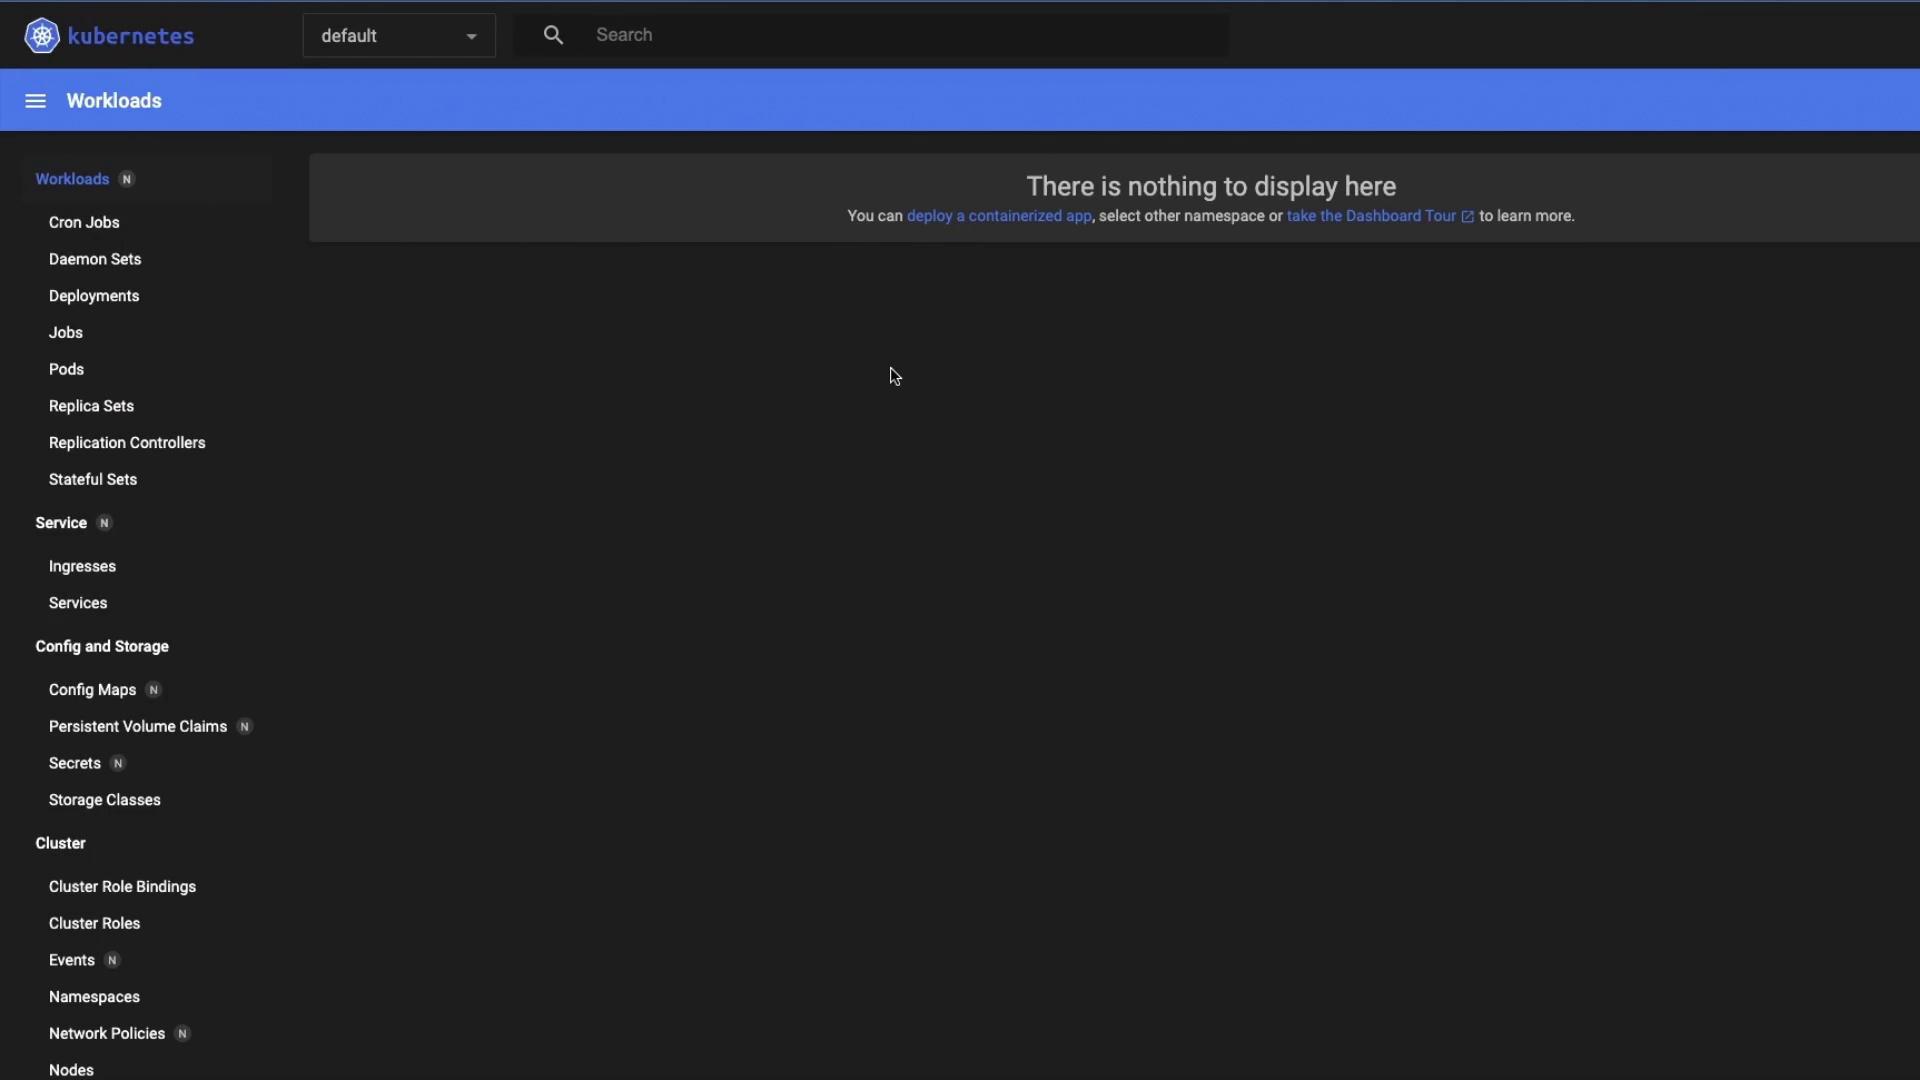
If you leave the dashboard exposed without proper authentication, anyone with the URL and token can view or modify your cluster. Always secure access.
Switching Namespaces
Use the namespace dropdown in the top-right corner to choose kube-system and inspect core components: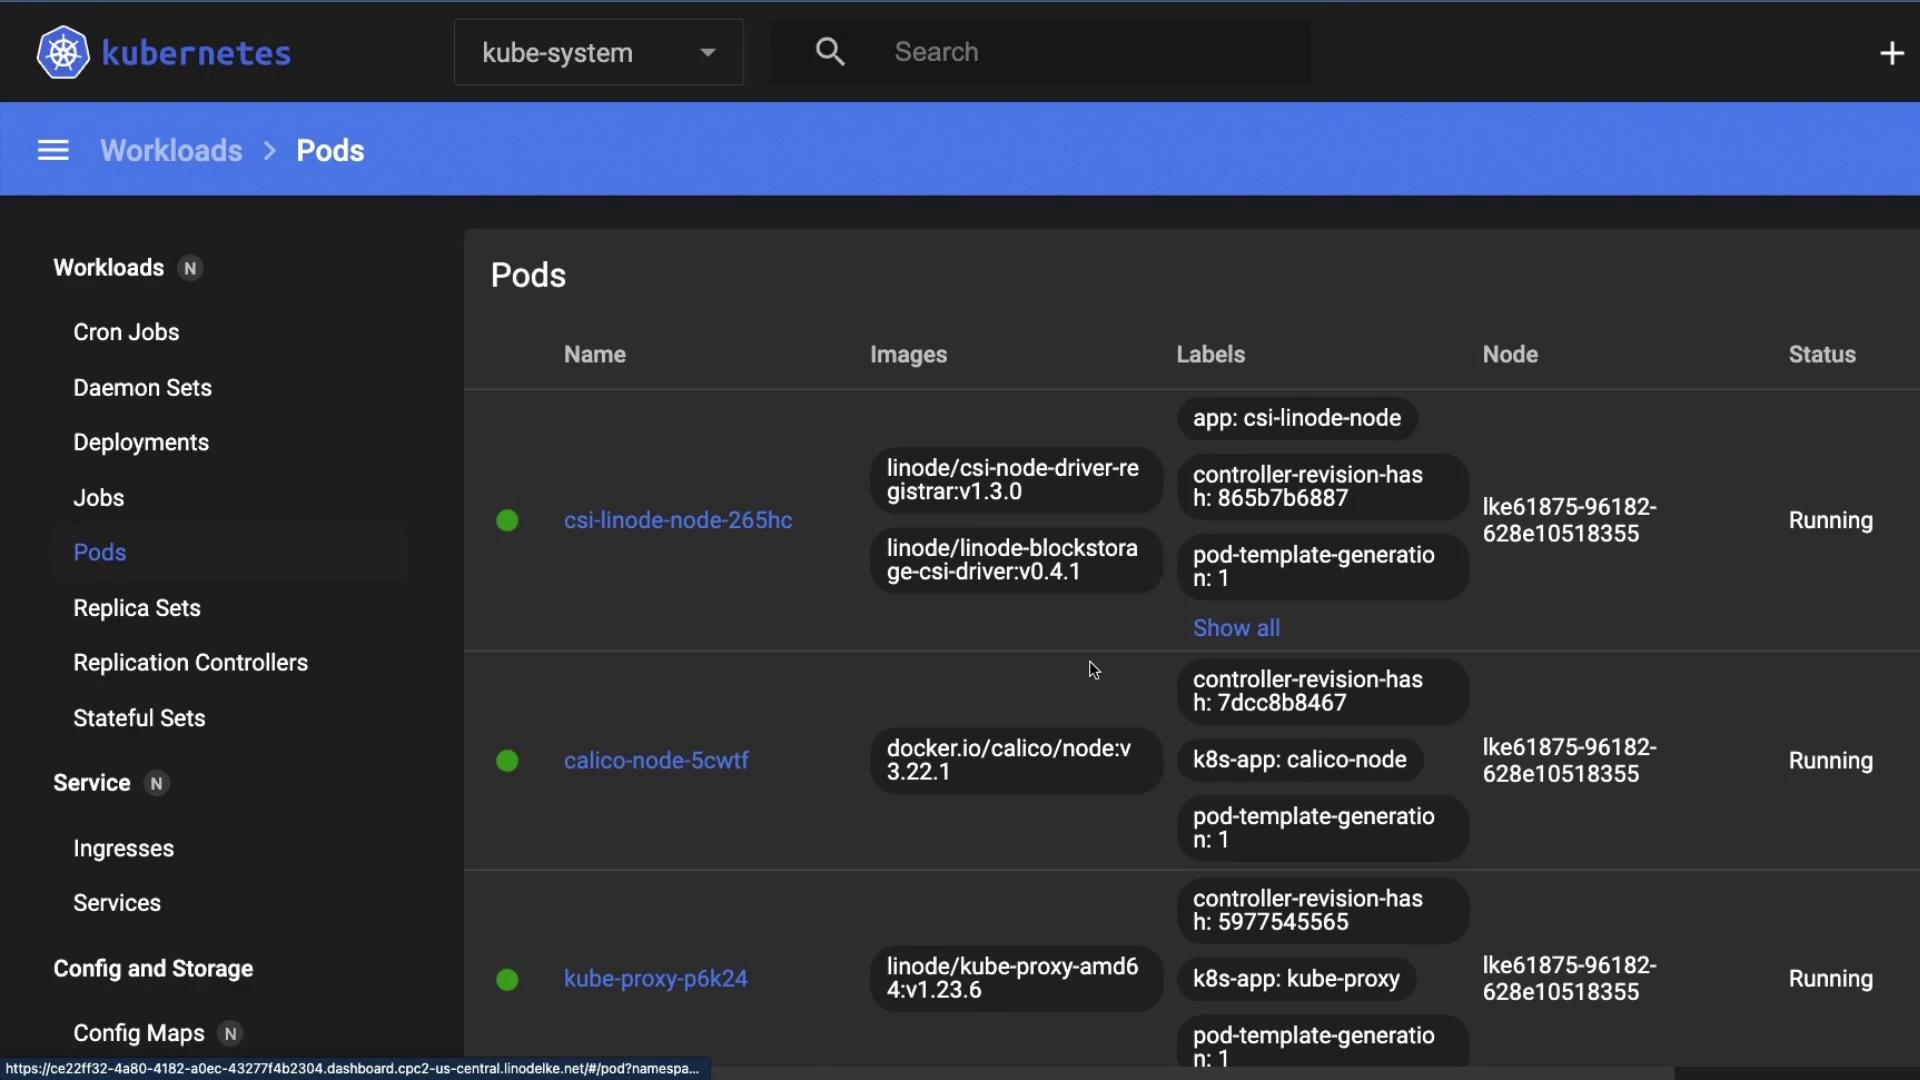
3. Inspecting Deployments
Select Deployments under Workloads to view system controllers like CoreDNS and Calico: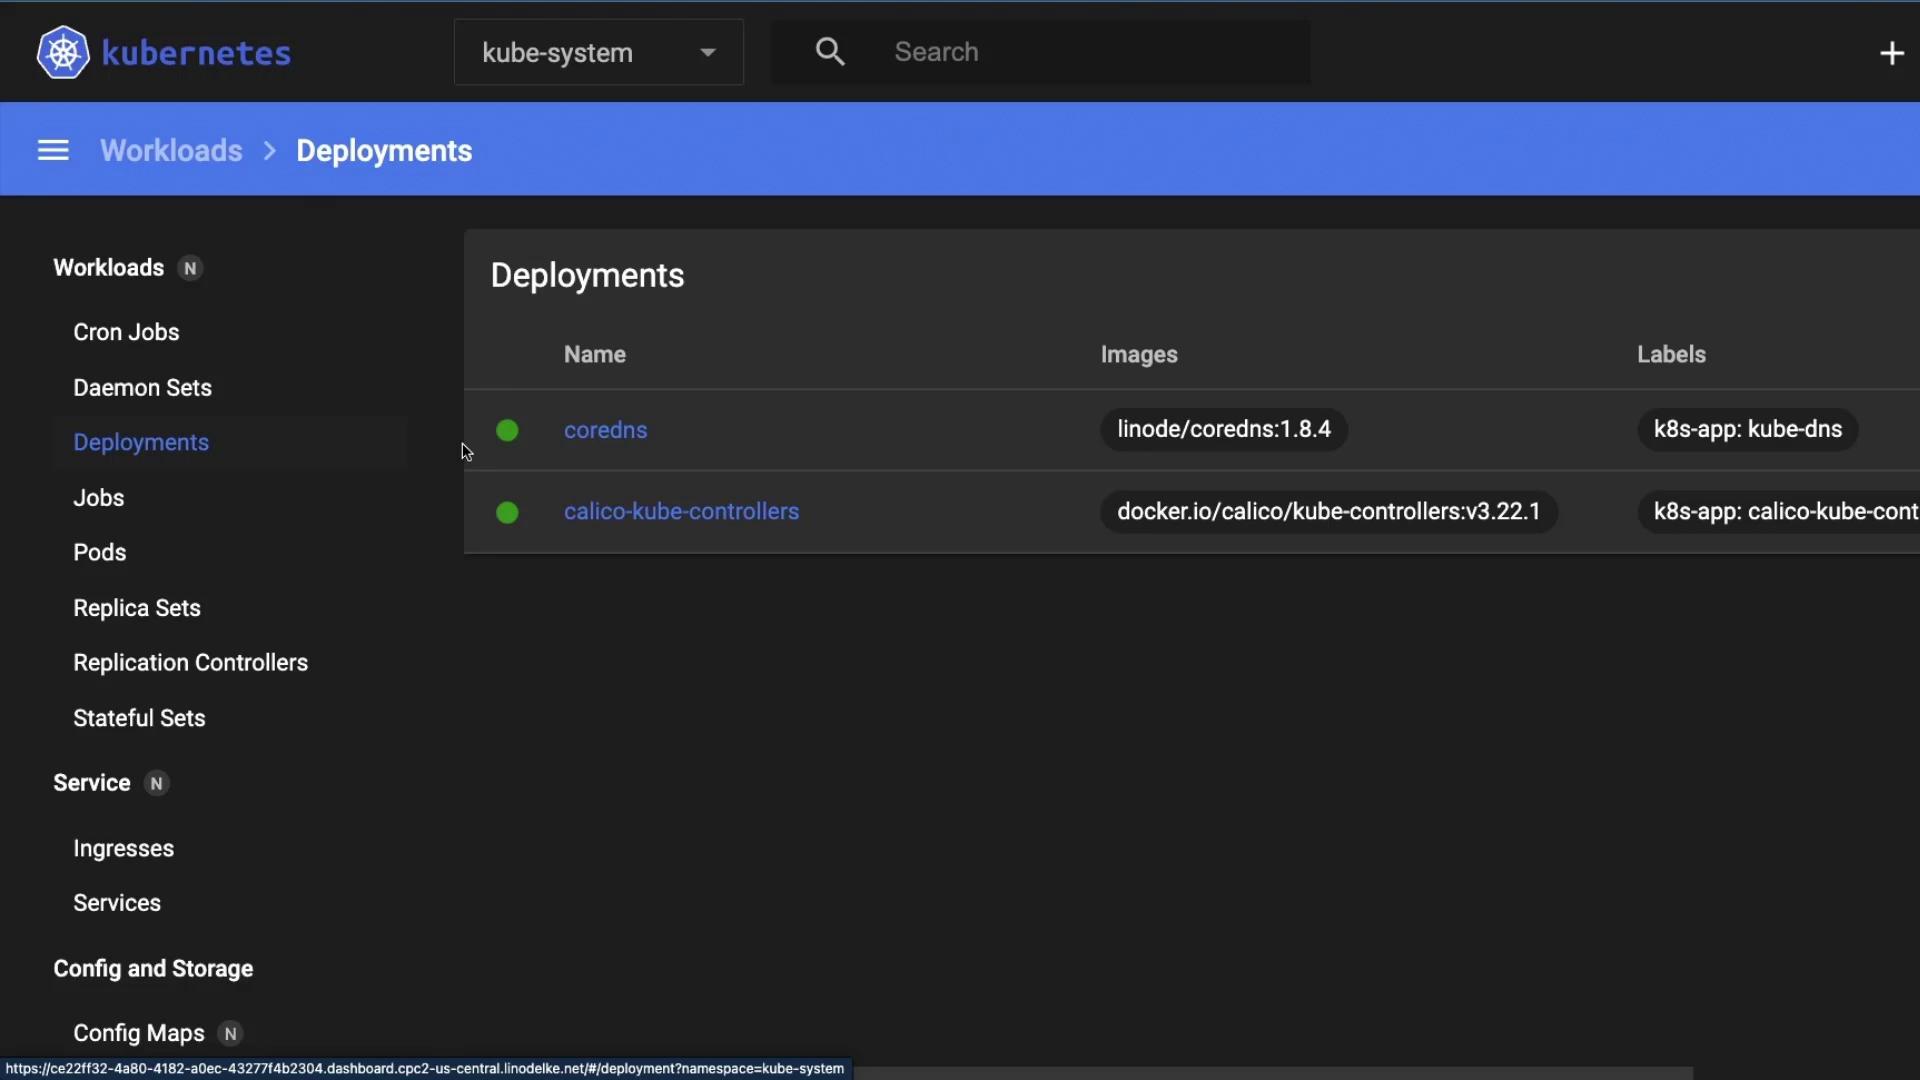
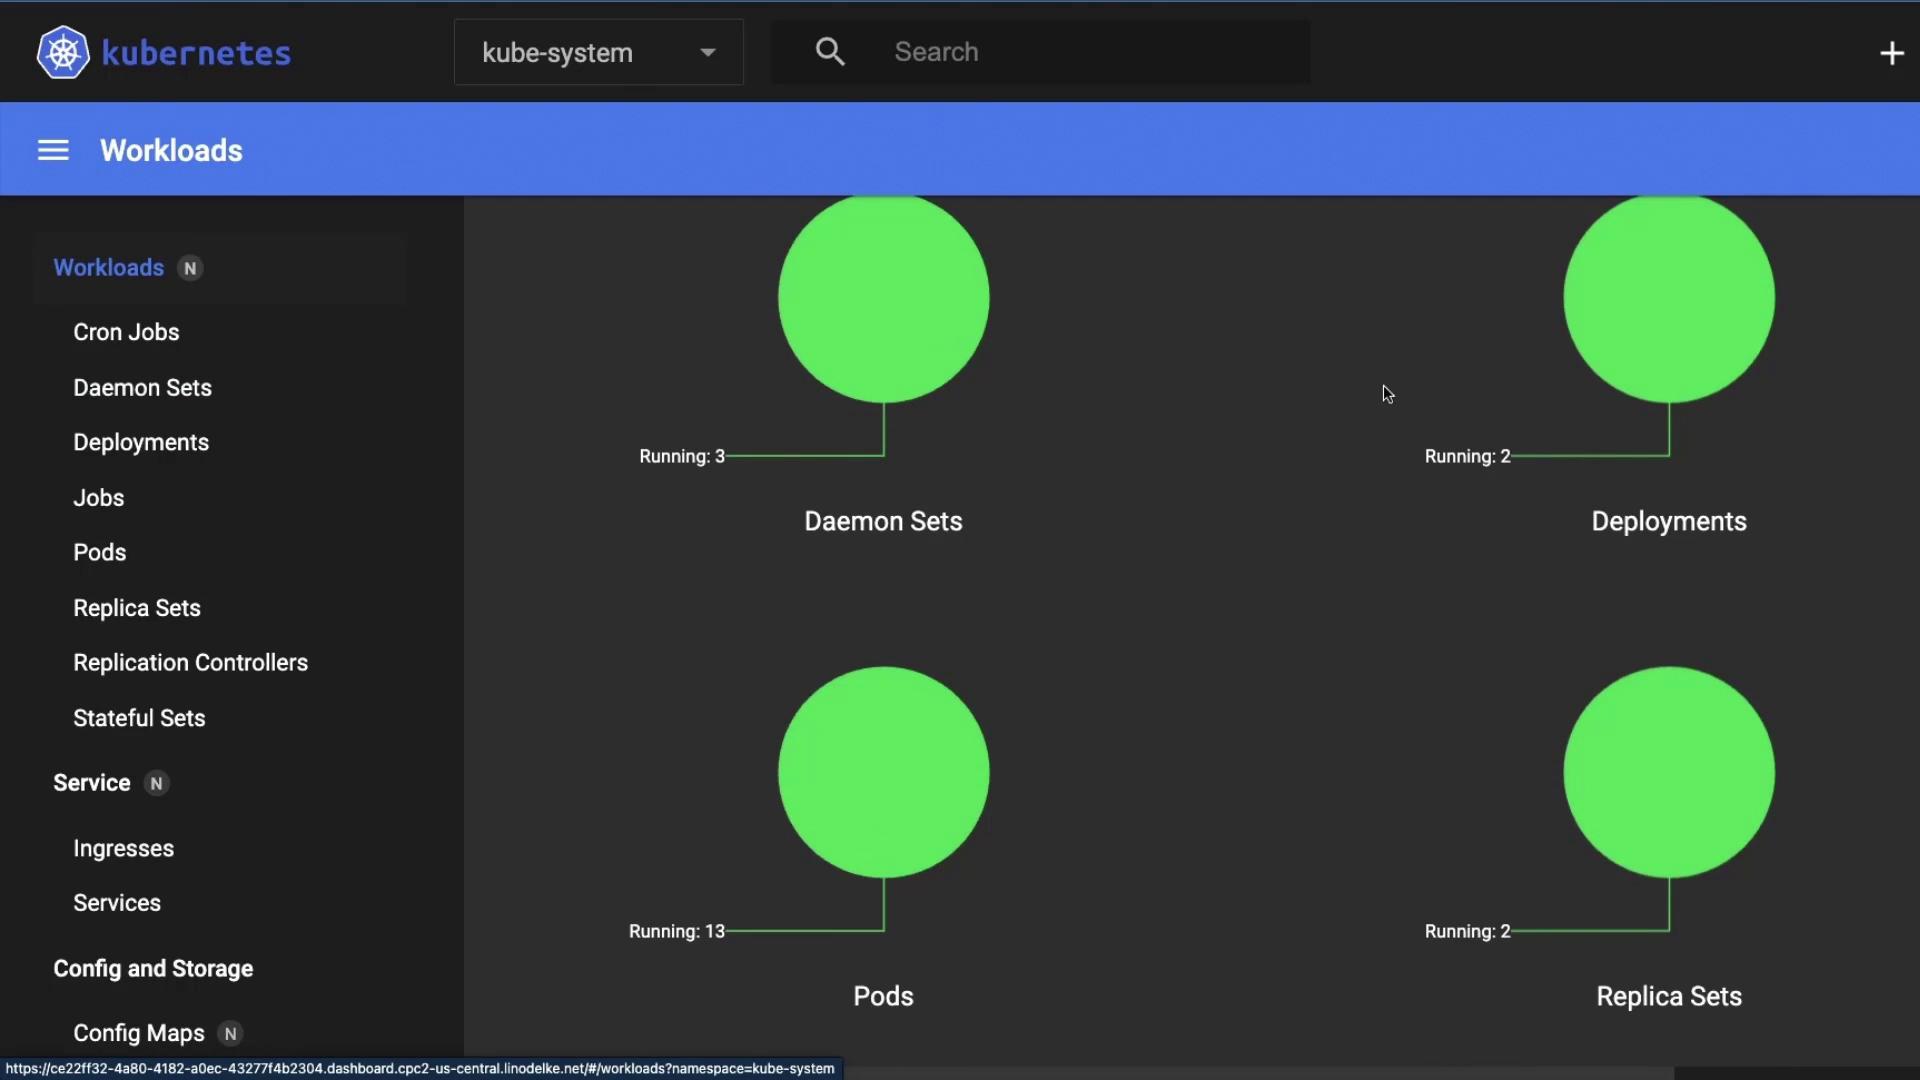
4. Workloads Overview
Under Workloads, you can monitor all controllers:| Workload Type | Description |
|---|---|
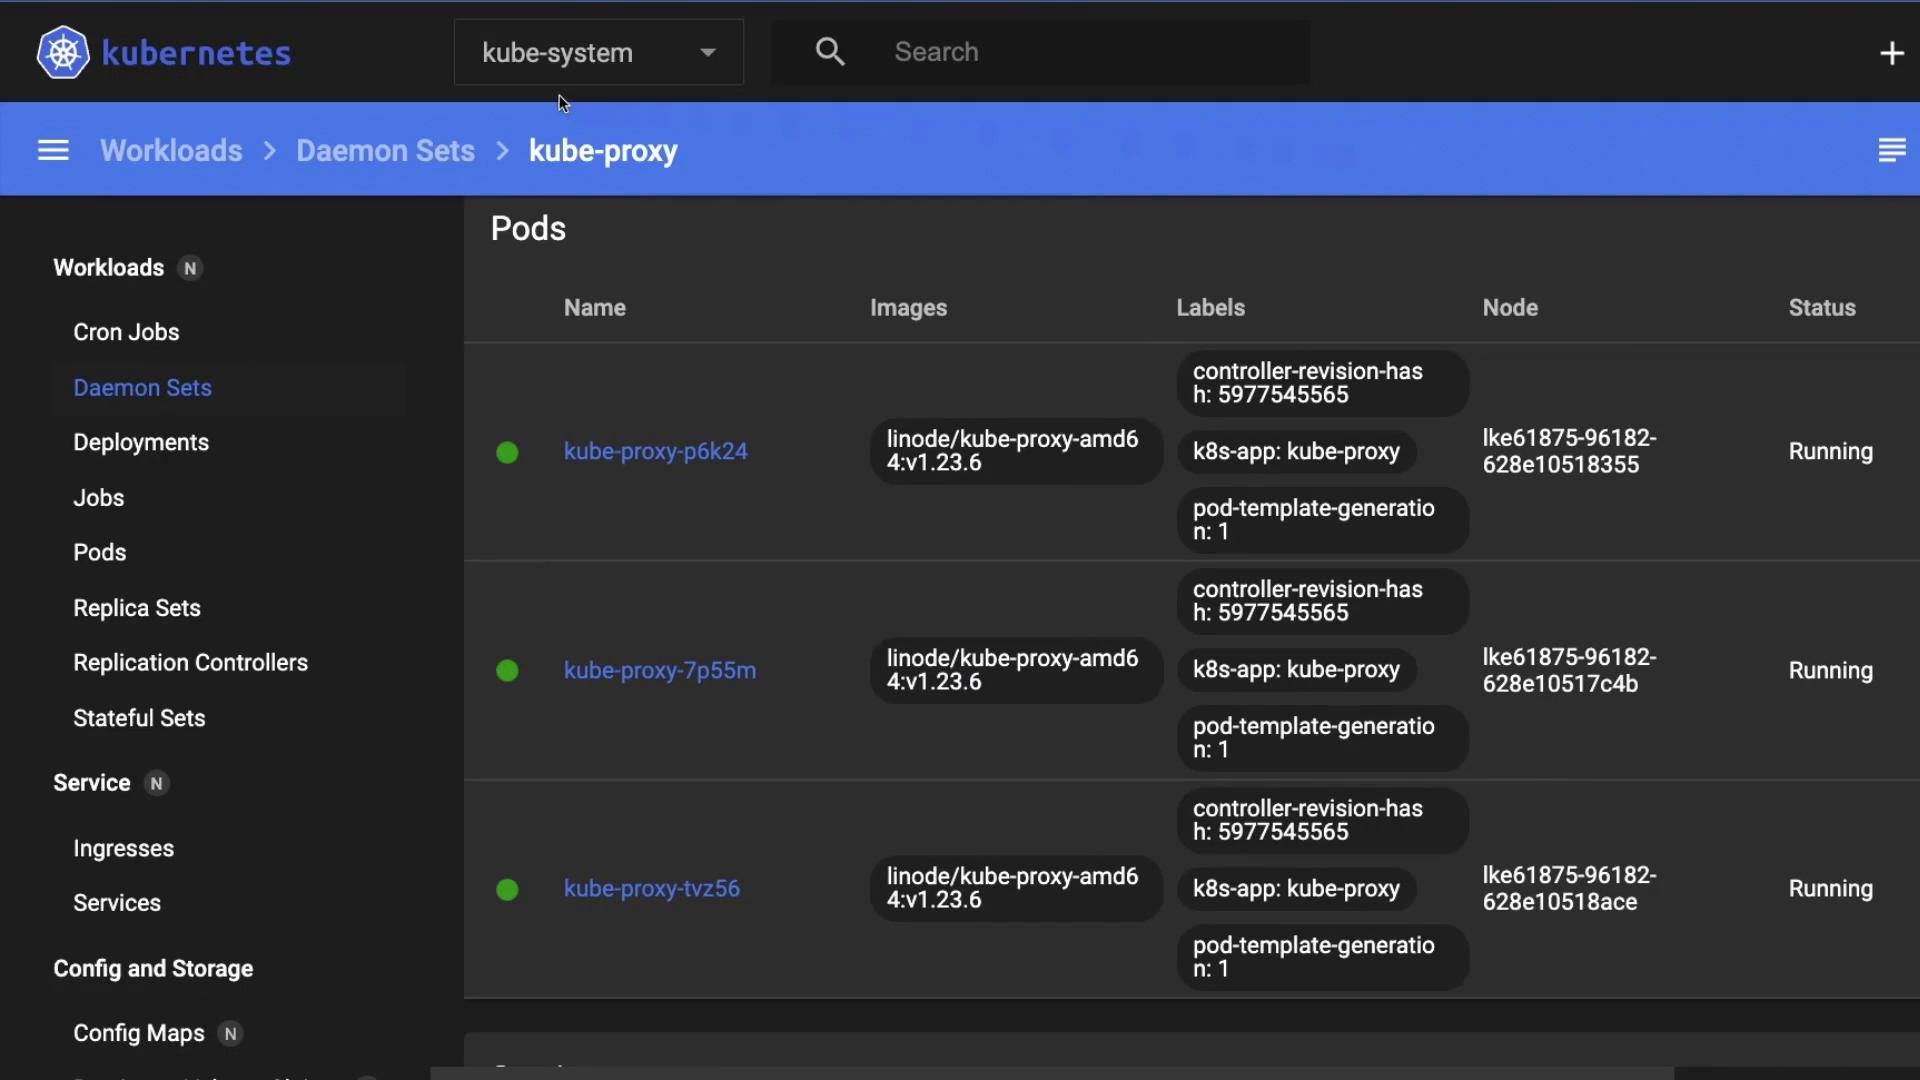
| Daemon Sets | Run one pod per node (e.g., kube-proxy) |
| Deployments | Declarative updates & scaling |
| Replica Sets | Maintain a stable set of replicas |
| Pods | The smallest deployable unit |
5. Services, Config & Storage
Beyond workloads, the sidebar lets you explore:- Services: ClusterIP, NodePort, LoadBalancer endpoints
- Config and Storage: ConfigMaps, Secrets, PersistentVolumes, PVCs
- Access Control: Roles, RoleBindings, ServiceAccounts