Why HPA Matters: A Factory Analogy
Imagine a manufacturing plant that employs a fixed number of workers every day. All runs smoothly—until demand suddenly spikes (say, right after the holidays). The static team can’t keep up, orders back up, and production grinds to a halt. In the world of applications, a similar scenario unfolds when user traffic surges beyond expected levels.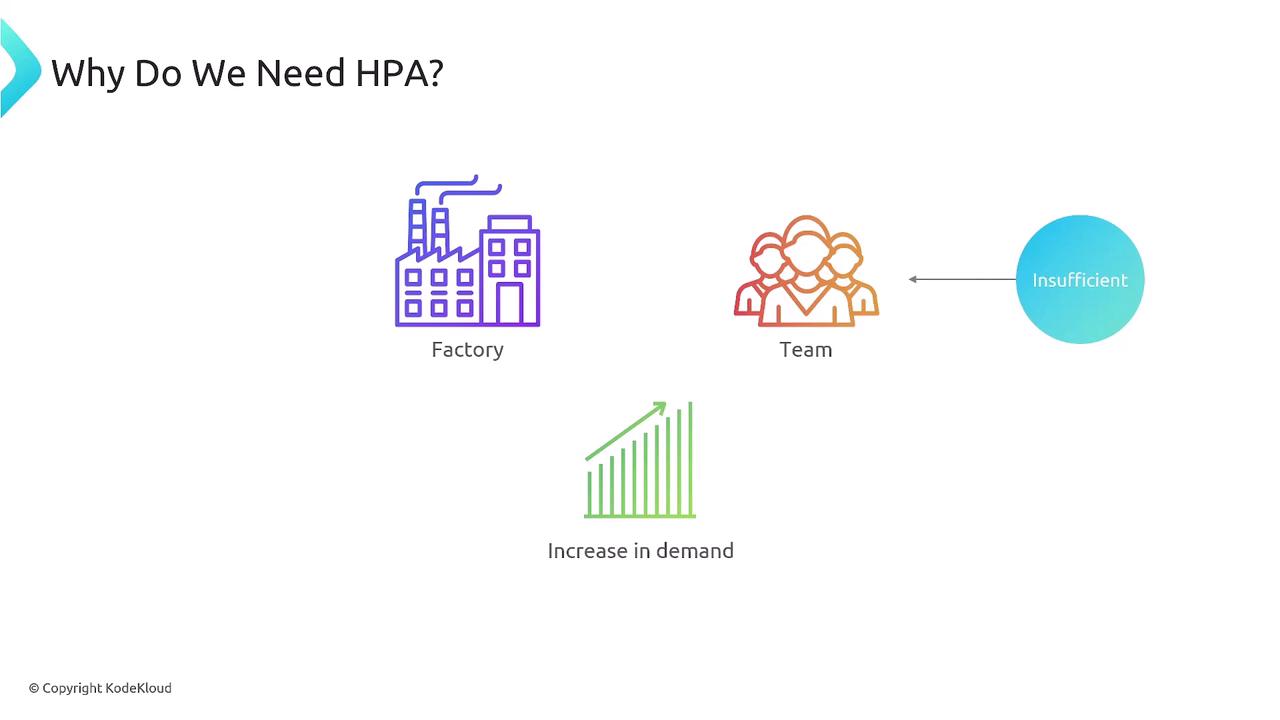
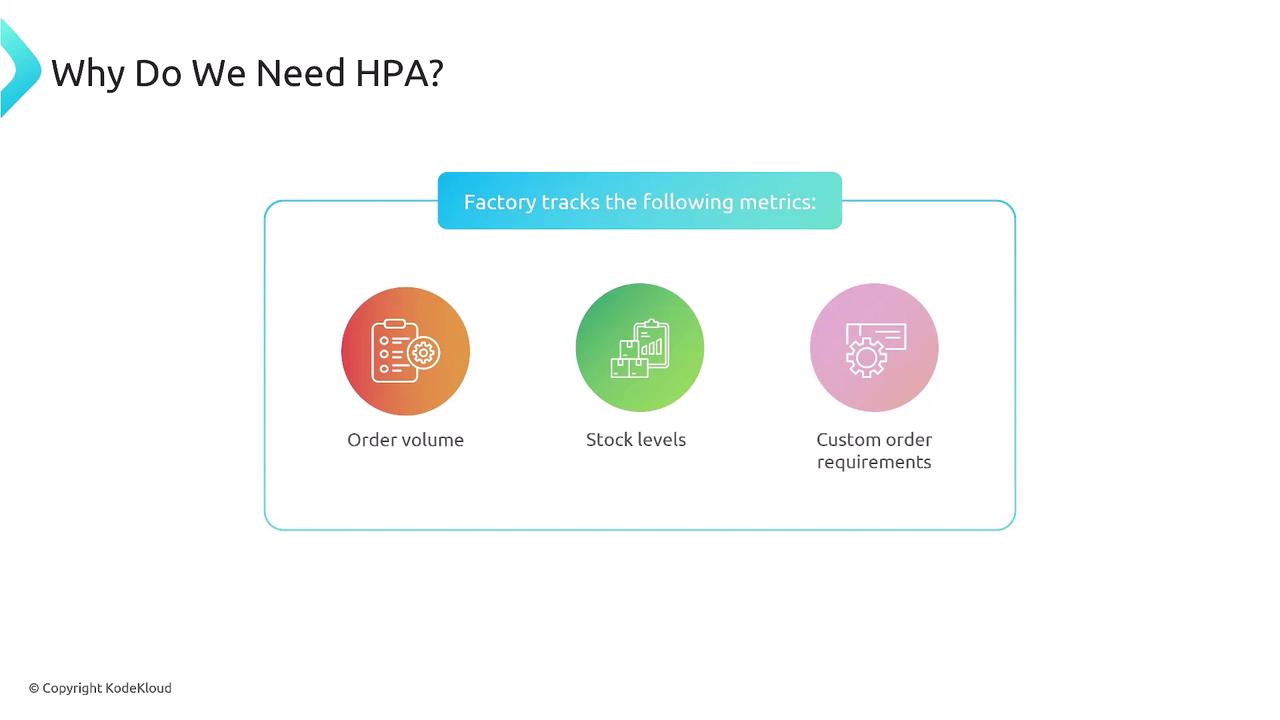
Key Triggers for Scaling
When stock falls below a threshold or special orders demand extra handling, the factory hires more workers. Similarly, if your application’s CPU or memory usage crosses your defined thresholds, HPA will scale out your pods to maintain performance.How the Horizontal Pod Autoscaler Works
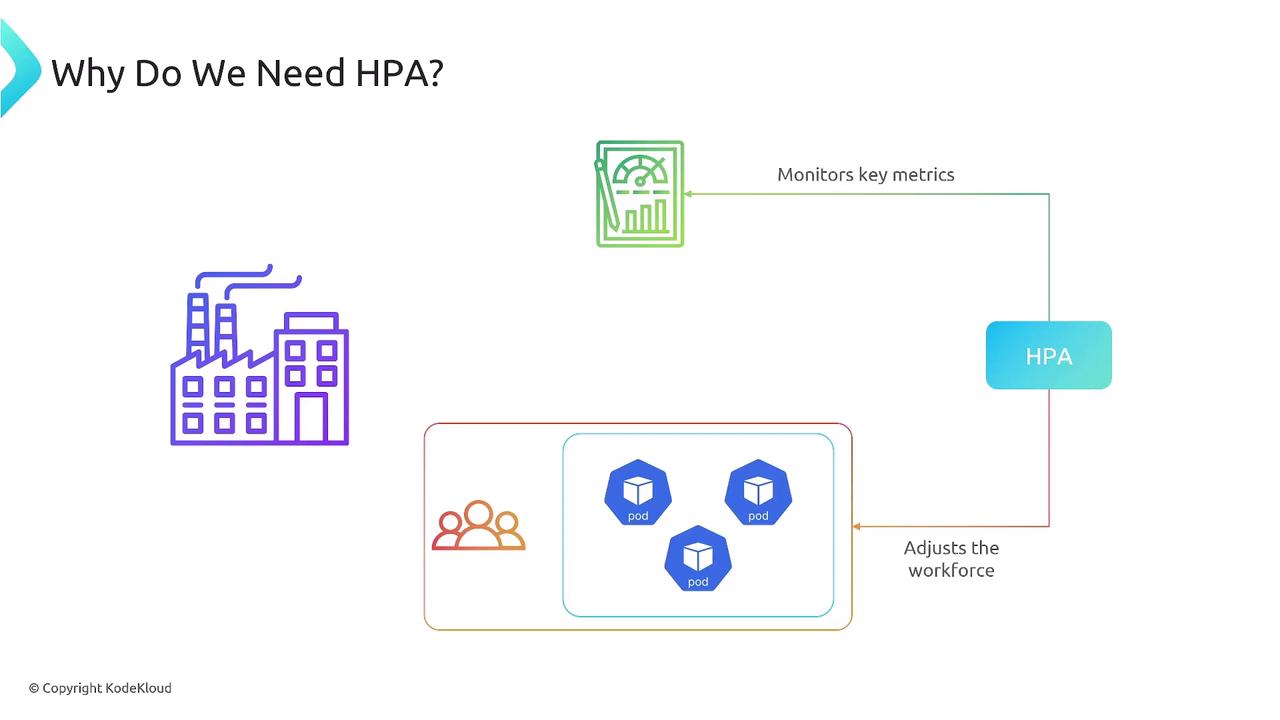
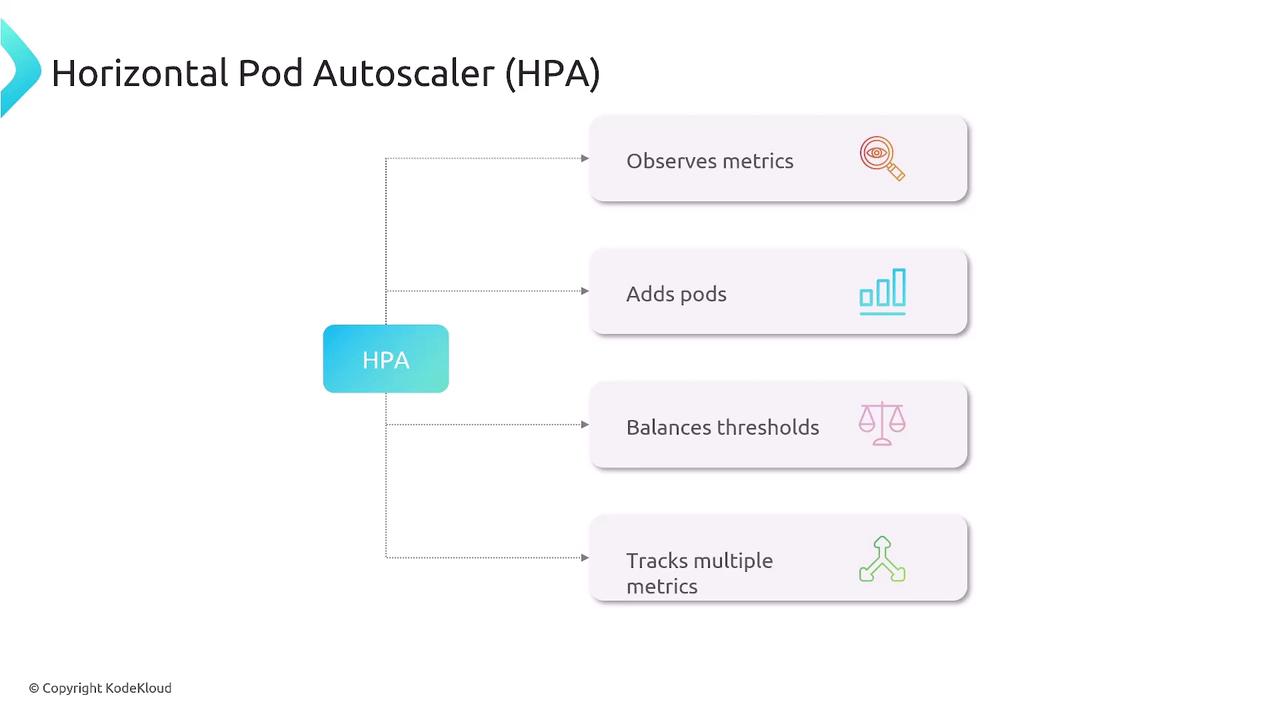
Think of HPA as an automated supervisor that:- Continuously gathers metrics (CPU, memory, custom)
- Compares them against target thresholds
- Adjusts the replica count of your Deployment, StatefulSet, or ReplicaSet
HPA Metrics Overview
| Metric Type | Use Case | Default Support | Customizable |
|---|---|---|---|
| CPU Utilization | Scale on CPU load | ✔️ Yes | — |
| Memory Utilization | Scale on memory consumption | — | ✔️ Yes |
| Custom Metrics | Application-specific KPIs (e.g., queue length) | — | ✔️ Yes |
| External Metrics | Third-party services (e.g., cloud pub/sub) | — | ✔️ Yes |
HPA relies on the Kubernetes Metrics Server or a Custom Metrics API to retrieve resource usage. Ensure it’s installed and configured in your cluster.
Relying only on CPU metrics can leave memory-heavy workloads unprotected. Always evaluate your application’s bottlenecks and configure HPA to use all relevant metrics.